
There is a difference between Red and Blue States
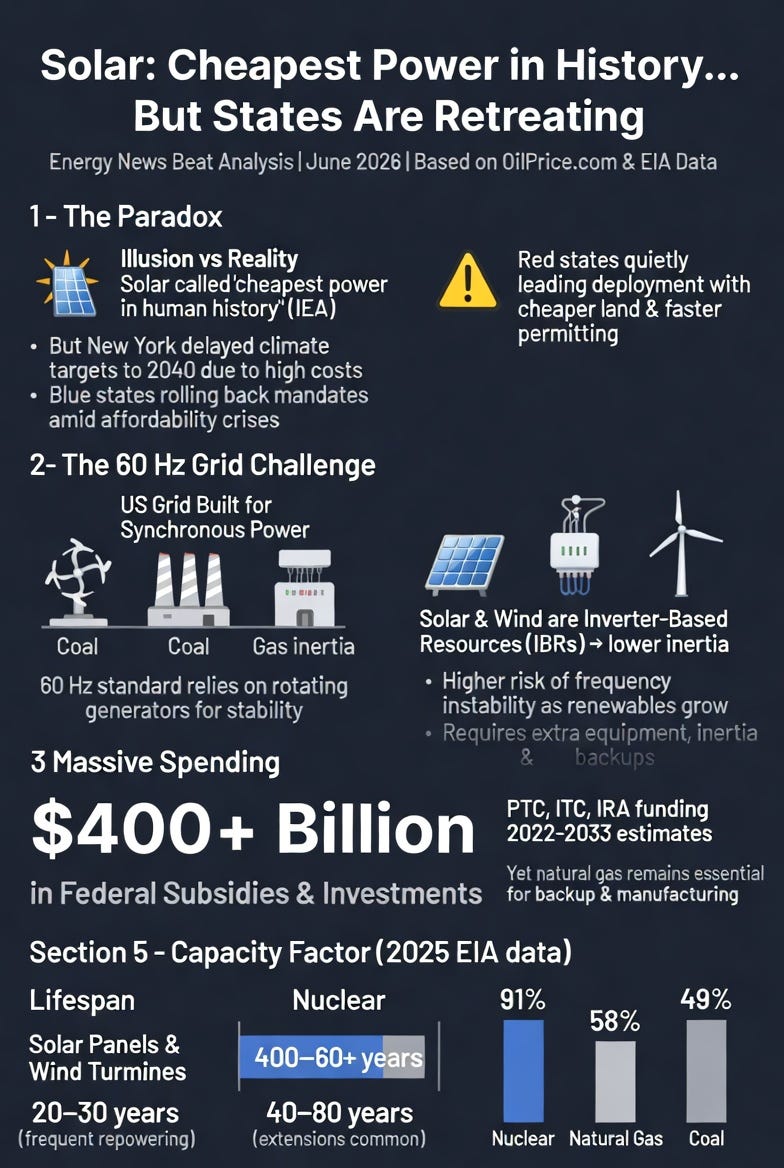
The headline from a June 19, 2026, OilPrice.com article captures a striking tension in U.S. energy policy: solar is repeatedly called “the cheapest power in human history” by sources like the IEA, yet multiple states—particularly blue ones—are dialing back aggressive renewable targets amid rising costs, reliability concerns, and shifting federal priorities. This article was first published on the Energy News Beat Substack. Please leave your comments there.
This piece breaks down the claims, the data on costs and performance, the realities of the U.S. grid, material and land demands, and why policy differences between states matter more than the raw technology claims suggest.
The Core Claim: Solar LCOE vs. Real-World System Costs
Proponents cite Levelized Cost of Energy (LCOE) figures showing utility-scale solar and onshore wind as the lowest-cost new-build options in many regions.
Recent analyses (e.g., from BNEF and others) place unsubsidized solar and wind in competitive or leading positions relative to new natural-gas combined-cycle or coal plants.
However, LCOE is not the full story. It measures lifetime costs divided by energy produced for a single project in isolation. It largely excludes:
- Grid integration costs (transmission upgrades, frequency regulation).
- Backup or firming capacity is needed for intermittency.
- Overbuilding or curtailment.
- The shorter replacement cycles of renewable assets.
When these system-level costs are included, the picture changes significantly. Studies show reliability adders can multiply solar’s effective cost by factors of 11–42x in some scenarios.
Existing, fully depreciated coal, gas, and nuclear plants often deliver power far more cheaply on a marginal basis than new renewables plus the required supporting infrastructure.
The U.S. 60 Hz Grid: Built for Synchronous Generation
The continental U.S. operates on a 60 Hz alternating current (AC) grid—a standard rooted in historical engineering choices by companies like Westinghouse. This synchronous system relies on large rotating generators (coal, natural gas, nuclear, hydro) that provide inertia—rotational mass that resists sudden changes in frequency and helps stabilize the grid during disturbances.
We remember last year’s Spanish crisis, and quite honestly, I am surprised we have not seen more of that in the United States.
Solar and wind are inverter-based resources (IBRs). They produce DC power that must be converted to AC via power electronics (inverters). These lack inherent rotational inertia.
As their share grows:
System inertia declines.
Rate of Change of Frequency (RoCoF) increases during events.
More fast-acting reserves, synthetic inertia from batteries/grid-forming inverters, or synchronous condensers become necessary.
High penetrations of IBRs require substantial additional equipment and operational changes to maintain the stability of the 60 Hz grid around which it was designed. This is not theoretical—grid operators worldwide are actively studying and mitigating these effects.
Billions Spent on Wind, Solar, and Storage—With Mixed Results
Federal support has been enormous. The Inflation Reduction Act (IRA) and prior policies funneled hundreds of billions into renewables and storage through Production Tax Credits (PTC), Investment Tax Credits (ITC), and related programs.
One Treasury estimate projected ~$425 billion in PTC/ITC costs for alternative energy over a decade; broader analyses of IRA energy provisions range from nearly $1 trillion to over $4 trillion in some long-term scenarios when including manufacturing incentives and other supports.
Private investment in energy transition technologies also hit record levels (hundreds of billions annually in recent years per BNEF tracking). Battery storage deployments have accelerated dramatically.
Despite this, natural gas remains the dominant flexible backup fuel in most markets. Renewables growth has often been paired with continued or increased gas-fired generation for reliability, especially during low wind/solar periods or peak demand. Manufacturing solar panels, wind turbines, steel, cement, and rare-earth components relies heavily on fossil fuels (coal for high-temperature processes, diesel for mining/transport, natural gas for various industrial steps). The upstream fossil energy embedded in renewables is real and non-trivial, even if operational emissions are near-zero.
Lifespan, Replacement, and Long-Term Economics
Typical asset lives differ sharply:
Solar panels are claimed to last 25–30 years (with gradual degradation of ~0.5–0.8% per year). In Texas, that is not true, as we can see from the hailstorms, and the typical lifespan is about 5 to 7 years before degradation.
Wind turbines are claimed to last 15–25 years (blades, gearboxes, and other components often require major refurbishment or replacement well before full retirement). We have found through whistleblowers working in the fields that after 3 years, maintenance money and subsidies are diverted to nameplate upgrades, and the “Bum Rush” we are seeing now is to get installs done before those subsidies fade out as the Trump Administration winds them down.
When confronted, wind and solar companies have provided maintenance records proving they are profitable without additional subsidies or rate increases. We have found repeatedly that 8 years is the magic number for rate increases.
Coal plants: Often 40–60+ years with maintenance.
Natural gas combined-cycle: 30–50+ years.
Nuclear: 40–60 years initial license, with many extended to 80 years.
Renewables generally require full or major replacement cycles every 20–30 years for equivalent long-term output, versus 40–80 years for thermal plants. While O&M costs for operating renewables are low (no fuel), the capital intensity of repeated rebuilds, plus disposal/recycling challenges (especially wind blades and solar panels), adds up over decades. Nuclear and well-maintained fossil plants benefit from long amortization periods once built.
Claims of 5–10-year replacement cycles appear overstated for modern equipment, but the fundamental point holds: renewables have shorter economic lives and higher long-term reinvestment needs than dispatchable thermal baseload sources.
Material and Land Intensity
Wind and solar are more material-intensive per unit of capacity (and often per unit of energy delivered due to lower capacity factors):
Wind: Hundreds of tons of steel and concrete per turbine; significant rare-earth elements for magnets in many designs.
Solar: Steel/aluminum framing, vast amounts of glass, silicon (energy-intensive purification), silver, and other metals across huge arrays.
Cement/concrete: Often higher per MW for renewables foundations and infrastructure.
Nuclear and fossil plants use substantial steel and concrete too, but deliver far higher energy output over much longer periods from a compact footprint.
Land use (approximate, nameplate basis from various analyses):
Coal/natural gas/nuclear: ~12 acres per MW.
Solar: ~40–50+ acres per MW.
Wind: ~70+ acres per MW (though much of the area between turbines can often be dual-used for agriculture/grazing; direct footprint is smaller).
Per unit of actual electricity produced (accounting for capacity factor), nuclear is dramatically more land-efficient than solar or wind. Solar farms in particular can require hundreds to thousands of acres per TWh/year, depending on location and technology.
Intermittency, Capacity Factors, and the Backup Reality
2025 EIA data show stark differences in average capacity factors (actual output vs. maximum possible):
Nuclear: ~91%.
Coal: ~49%.
Natural gas: ~58%.
Wind: ~34%.
Utility-scale solar PV: ~24%.
Solar and wind are variable by nature—night/clouds for solar; calm periods for wind. They require overbuilding, long-duration storage (still expensive and scaling), demand response, or dispatchable backups (mostly natural gas peakers or combined-cycle plants) to ensure 24/7 reliability. DC-to-AC inversion adds equipment costs, efficiency losses (~2–5% or more in some systems), and potential power quality issues.
This is why, despite record renewable additions, fossil fuels (especially natural gas) continue to play a critical role. More aggressive renewable mandates and spending often correlate with sustained or increased reliance on gas for firming rather than outright displacement in many grids.
Why Blue States Are Shifting—and Why Red States Often Have Lower Prices
The OilPrice article highlights examples like New York delaying its climate targets (pushing 2030 goals to 2040 amid lawsuits and cost concerns) and broader rollbacks or softening of commitments in states facing affordability pressures. California has faced legal and practical challenges with high energy costs and mandates.
Data consistently show blue/Democratic-leaning states often have significantly higher average electricity prices than red/Republican-leaning ones.
Recent 2025–2026 figures put the U.S. average for residential electricity at 17–19 ¢/kWh, with California frequently above 30 ¢/kWh, New England states in the high 20s–30s, and Hawaii much higher.
Many of the lowest-cost states (North Dakota, Arkansas, Wyoming, etc.) are red-leaning, often in the low-to-mid teens ¢/kWh. Analyses indicate blue states pay roughly 30–40% more on average in some comparisons.
Contributing factors include:
Stricter environmental regulations and renewable portfolio standards.
Higher taxes, fees, and compliance costs.
More transmission/distribution spending tied to renewable integration.
Less emphasis on abundant local fossil resources in some cases.
Red states frequently benefit from lighter regulatory burdens, faster permitting in some areas, cheaper land, and market-driven approaches. Ironically, several red states (Texas, for example) lead the nation in actual wind and solar deployment due to these advantages—showing that economics and land availability often trump partisan rhetoric.
Federal policy shifts (e.g., under the current administration) have slowed some permitting and leasing, but deployment continues where economics align, particularly in red and purple states with favorable conditions.
The Broader Trend: Spending More on Renewables Often Means More Fossil Use Upstream and for Backup
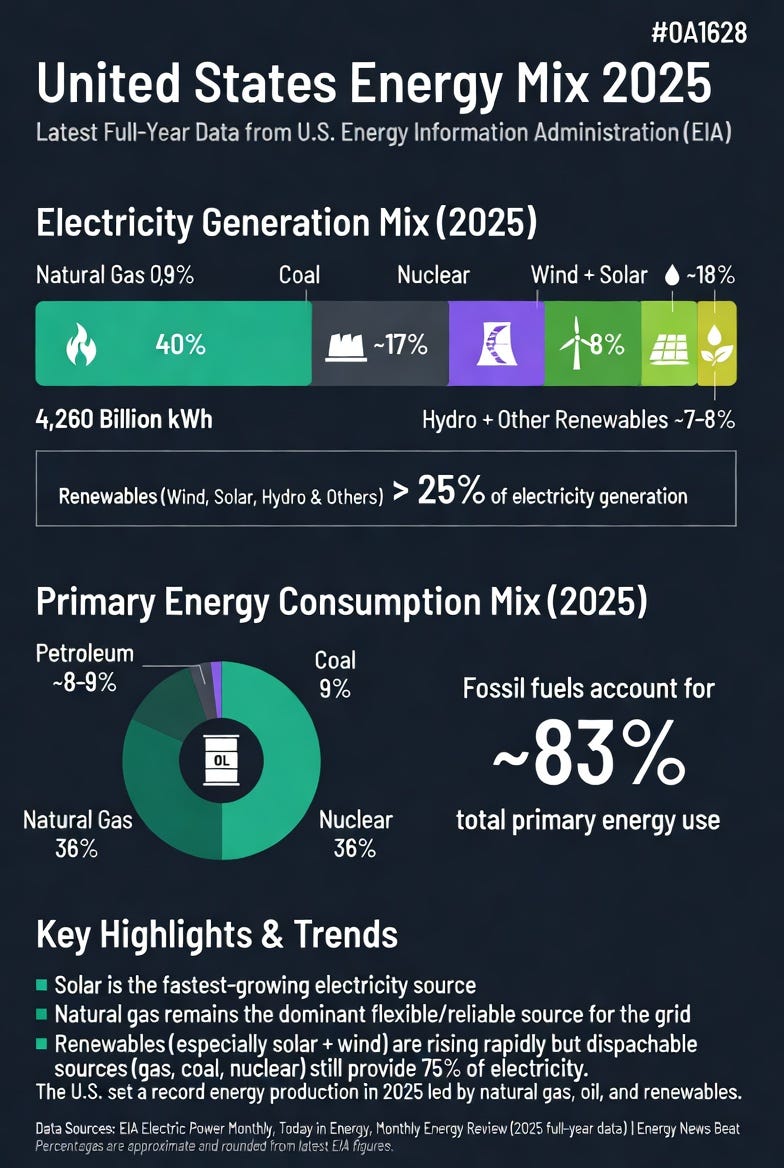
The data supports the counterintuitive pattern the user highlighted: aggressive renewable subsidies and mandates have coincided with continued heavy reliance on natural gas (and sometimes coal) for reliability and manufacturing supply chains. You cannot mass-produce steel, cement, silicon, turbines, or panels at scale without substantial fossil energy inputs today. Intermittency necessitates gas-fired flexibility in most real-world grids.
This does not mean renewables have no role—they are excellent for certain applications and have driven impressive cost declines. But pretending they are universally “the cheapest” without accounting for the full system, replacement cycles, materials, land, and grid physics leads to policy missteps, higher consumer costs, and reliability risks.
Conclusion
Solar and wind have achieved remarkable cost reductions and now contribute meaningfully to U.S. generation. However, the claim that they represent the cheapest power “in history” without major caveats ignores integration realities, shorter asset lives, material intensity, and the continued need for dispatchable resources. States retreating or adjusting timelines are responding to real affordability and reliability pressures, not ideology alone.
And no one is talking about the $89 billion Land Reclaimation problem for wind only in the United States, or the “Replacement Treadmill” that wind and solar have.
Blue states’ higher costs stem largely from regulatory overreach, taxes, and policy choices—not inherent technology flaws. Red states demonstrate that lighter-touch approaches often deliver lower prices while still allowing renewable growth where it makes economic sense.
A pragmatic path forward prioritizes all low-carbon and reliable options—including nuclear (long-life, high-capacity-factor, low-land), natural gas as a bridge/transitional fuel, and renewables where they truly lower system costs—while reforming regulations that inflate prices without delivering proportional benefits. Energy abundance and affordability remain foundational to prosperity.
So when David Allen on the Energy News Beat podcast dubbed the phrase “The more we spend on Wind, Solar and Storage, the more fossil fuels we will use” as “Turley’s Law,” he was right. We have spent 10 trillion on wind and solar, only to gain an additional 3% in energy.
While much of this article has been discussed before, I tried to lay it out in a format that helps. With the “Bum Rush” for subsidies in play, we will be able to see in several years if solar installations continue to gain in percentage terms.
David Blackmon’s article today Solar Doesn’t Use Much Farmland – Until You Define What ‘Much” Really Means,” was outstanding.
We need to defend our farmland, and if we deploy solar, put it on parking garages, homes, or buildings. NOT FARM LAND.
Do not get me wrong: I am installing more solar and storage at my places as I plan for grid outages due to natural or man-made disasters. That is a personal choice, and my neighbor should not be charged if I want backup power. They are more than welcome to come over for coffee or dinner when the power is out. I have brought them spare generators in storms to help in the past, and that is what we all need to do. I love helping people.
Help your neighbors, even when they don’t vote like you.
Thanks again for all of our paid subscribers, patrons, and sponsors. You mean the world to us. Please let me know what key topics and problems in your areas are!

Appendix: Key Sources and Links
- OilPrice.com article referenced: https://oilprice.com/Alternative-Energy/Solar-Energy/Solar-Is-the-Cheapest-Power-in-History-But-States-Are-Retreating-From-It.html (June 19, 2026)
- U.S. grid frequency: Wikipedia Utility frequency; various engineering sources confirming 60 Hz standard.
- EIA capacity factors and generation data (2025): https://www.eia.gov/electricity/monthly/ (Tables 6.07.A/B and related)
- Electricity prices by state (2025–2026 data): ElectricChoice.com, ChooseEnergy.com, EIA Electric Power Monthly.
- Land use comparisons: Our World in Data; Strata Policy report (2017, acres/MW); NEI and MIT analyses.
- Material/embodied energy: Various studies including MIT Climate Portal, World Nuclear Association mineral requirements tables, industry reports on steel/concrete use.
- Subsidies/IRA costs: Treasury/Office of Tax Analysis projections; Cato Institute analysis of IRA energy provisions.
- Lifespan and economics: Multiple sources including Lazard LCOE reports (with caveats), World Nuclear Industry Status Report, American Experiment analyses, EIA plant data.
- Grid inertia/IBR challenges: NREL reports, technical papers on synchronous vs. inverter-based resources.
Additional supporting data drawn from BNEF Sustainable Energy Factbook, IRENA renewable cost reports, and peer-reviewed or government statistical sources. All figures are approximate and drawn from publicly available 2025–2026 data; readers should consult primary EIA and operator reports for the latest updates.
The post Solar Claims to be the Cheapest Power In History, and States are Running from it appeared first on Energy News Beat.