
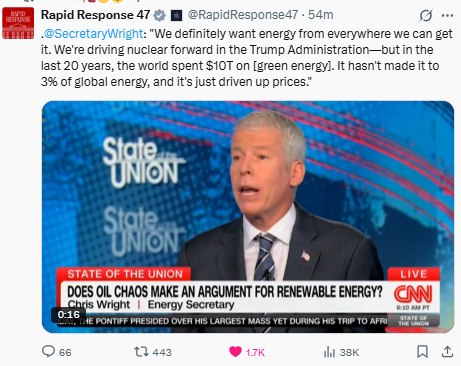
In a recent statement that has sparked widespread discussion, U.S. Energy Secretary Chris Wright highlighted a stark reality in the global push for renewables. Quoting from the White House Rapid Response account on X: “We definitely want energy from everywhere we can get it. We’re driving nuclear forward in the Trump Administration—but in the last 20 years, the world spent $10T on [green energy]. It hasn’t made it to 3% of global energy, and it’s just driven up prices.”
This claim cuts to the heart of two decades of massive investment in wind, solar, battery storage, and hydrogen. Has the return on that capital been worth it? And is it time to fundamentally rethink how we measure the true cost of these technologies — especially by tying wind and solar projects to the storage and grid resiliency they require, without subsidies?
Two Decades of Trillions in Green Investment
Global spending on clean energy technologies has surged. BloombergNEF reports that energy transition investment (including renewables, electrified transport, grids, storage, and low-emissions fuels) hit a record $2.3 trillion in 2025 alone, up 8% from the prior year. Renewables accounted for about $690 billion of that, with solar and wind leading the way.
The International Energy Agency (IEA) paints a similar picture: clean energy spending reached roughly $2.2 trillion in 2025, twice the amount going to oil, gas, and coal. Solar PV investment alone is projected at $450 billion.
Cumulatively over the past 20 years, these figures align closely with the $10 trillion cited. Earlier annual investments were lower but ramped up dramatically post-2015, with renewables, storage, EVs, and related infrastructure driving the total into the multi-trillion range. This includes not just power generation but battery storage (now ~$66 billion annually) and hydrogen projects (though the latter have seen delays and cancellations).
Wind and solar capacity exploded globally — with record additions in recent years — yet their contribution to total energy remains marginal when viewed through the lens of primary energy consumption.
The 3% Reality: Primary Energy vs. Headlines
Here’s where the numbers get sobering. Wind and solar together supply roughly 3% of global primary energy consumption as of recent data (2024-2025 figures from the Energy Institute Statistical Review and Our World in Data).
To be clear: In electricity generation, wind + solar reached ~15% globally in 2024 (rising toward higher shares in some regions).
But electricity itself is only about 20% of total final energy use. The rest — transport, heating, industry — still relies overwhelmingly on fossil fuels.
Broader renewables (including hydro and biomass) push the share of final energy consumption to ~13-20% by some projections through 2030, but variable renewables (wind/solar) lag far behind in the full energy mix.
Capacity factors tell part of the story: solar and wind operate at 20-40% utilization versus 80-90%+ for nuclear or gas. Add curtailment, transmission losses, and the need for overbuild, and the effective contribution shrinks.
Despite trillions invested, fossil fuels still dominate ~80% of primary energy. Prices have risen in high-renewable-penetration markets (e.g., parts of Europe and California) due to intermittency, grid upgrades, and backup needs — exactly as Secretary Wright noted.
Subsidies, Investor Returns, and the Taxpayer Tab
Renewables have not competed on a level playing field. Global public support has been substantial:
G20 governments provided at least $168 billion in financial support for renewable power in 2023 alone.
In the U.S., federal subsidies for renewables more than doubled to $15.6 billion by 2022 (tax credits, etc.).
Estimates of cumulative global renewable subsidies over the period run into hundreds of billions annually in recent years, via feed-in tariffs, tax incentives, and direct grants. (Fossil fuels receive explicit subsidies too — often estimated in the $1-7 trillion range when including externalities — but the per-unit energy support dynamics differ.)
Investors have received strong returns on paper through guaranteed power purchase agreements (PPAs), tax credits, and rising asset values. Yet the broader economy has paid via higher electricity rates in some regions, stranded assets, and the opportunity cost of capital not deployed elsewhere (e.g., nuclear or efficiency). Many projects rely on ongoing policy support; without it, economics shift.
Time for a Redefined Levelized Cost of Energy (LCOE)?
Traditional LCOE — the lifetime cost per MWh of generation — makes wind and solar look cheap. Lazard’s latest LCOE+ (2025) shows unsubsidized utility-scale solar at $38-78/MWh and onshore wind at $37-86/MWh. Even with storage hybrids, ranges are $50-131/MWh for solar + 4-hour storage.
But this metric ignores system-wide realities: intermittency requires massive storage, overbuild, transmission upgrades, and firming (backup dispatchable power). Standard LCOE treats renewables as if they provide reliable, on-demand power — they don’t.
Experts increasingly advocate for Levelized Full System Cost of Energy (LFSCOE) or System LCOE:
These include costs of storage, grid resiliency, curtailment, and backup to deliver firm power.
Studies show LFSCOE for solar/wind can be 3-10x+ higher than standalone LCOE in high-penetration scenarios, depending on assumptions about storage duration and backup.
A redefinition — mandating that wind/solar projects be evaluated with co-located storage and grid integration costs, on a no-subsidy basis — would reveal true pricing. Lazard already provides hybrid views; expanding this to full-system metrics (as proposed in academic and industry analyses) could force more honest project economics. Nuclear, with its high capacity factor and dispatchability, shines in such comparisons.
Conclusion: Lessons for Energy Abundance
The $10 trillion experiment shows that while renewables have grown impressively in niche applications, they have not delivered the transformative, affordable energy abundance promised. Intermittency, scale, and system costs remain barriers. An “all-of-the-above” strategy — prioritizing reliable baseload like nuclear alongside targeted renewables where they make economic sense — offers a pragmatic path forward.
Policymakers should demand full-system costing, subsidy transparency, and market-driven outcomes. Cheap, reliable energy powers prosperity. It’s time the metrics reflect reality.
Appendix: Sources and Links
- X Post (Secretary Wright quote): https://x.com/RapidResponse47/status/2045859786638422237
- IEA World Energy Investment 2025: https://www.iea.org/reports/world-energy-investment-2025/executive-summary
- BloombergNEF Energy Transition Investment Trends 2025: https://about.bnef.com/insights/clean-energy/bloombergnef-finds-global-energy-transition-investment-reached-record-2-3-trillion-in-2025-up-8-from-2024/
- Our World in Data / Energy Institute: Share of primary energy from solar & wind — https://ourworldindata.org/grapher/share-of-primary-energy-from-solar-and-wind
- Lazard LCOE+ Version 18.0 (June 2025): https://www.lazard.com/media/uounhon4/lazards-lcoeplus-june-2025.pdf
- IRENA / IEA reports on renewables and subsidies (various years).
- Academic papers on LFSCOE / System LCOE: See works by R. Idel et al. and related analyses.
- Additional context: EIA Annual Energy Outlook 2025 LCOE data.
Data as of April 2026. Figures are approximate based on latest public reports; actual totals vary by exact definitions of “green energy.”
The post The World Has Spent $10 Trillion on Green Energy — and Only Reached 3% of Global Energy appeared first on Energy News Beat.