
New York’s electricity grid is facing growing reliability risks, according to the state’s grid operator. In its latest assessments and the 2025 Power Trends Report, the New York Independent System Operator (NYISO) warns that electricity reserves have shrunk significantly over the past five years. A net decline of 1.5 gigawatts (GW) in available supplies since 2019 has left the state—home to nearly 20 million people—at heightened risk of shortfalls during peak summer and winter demand.
The NYISO’s Summer 2026 Capacity Assessment shows the baseline reliability margin has fallen to just 417 MW—the lowest in recent history—under normal conditions. This is down sharply from prior years (e.g., roughly half of 2025 levels in some comparisons). Extreme weather or higher-than-expected demand could push margins negative without emergency measures.
New York’s Electricity Mix: Still Heavily Reliant on Dispatchable Sources
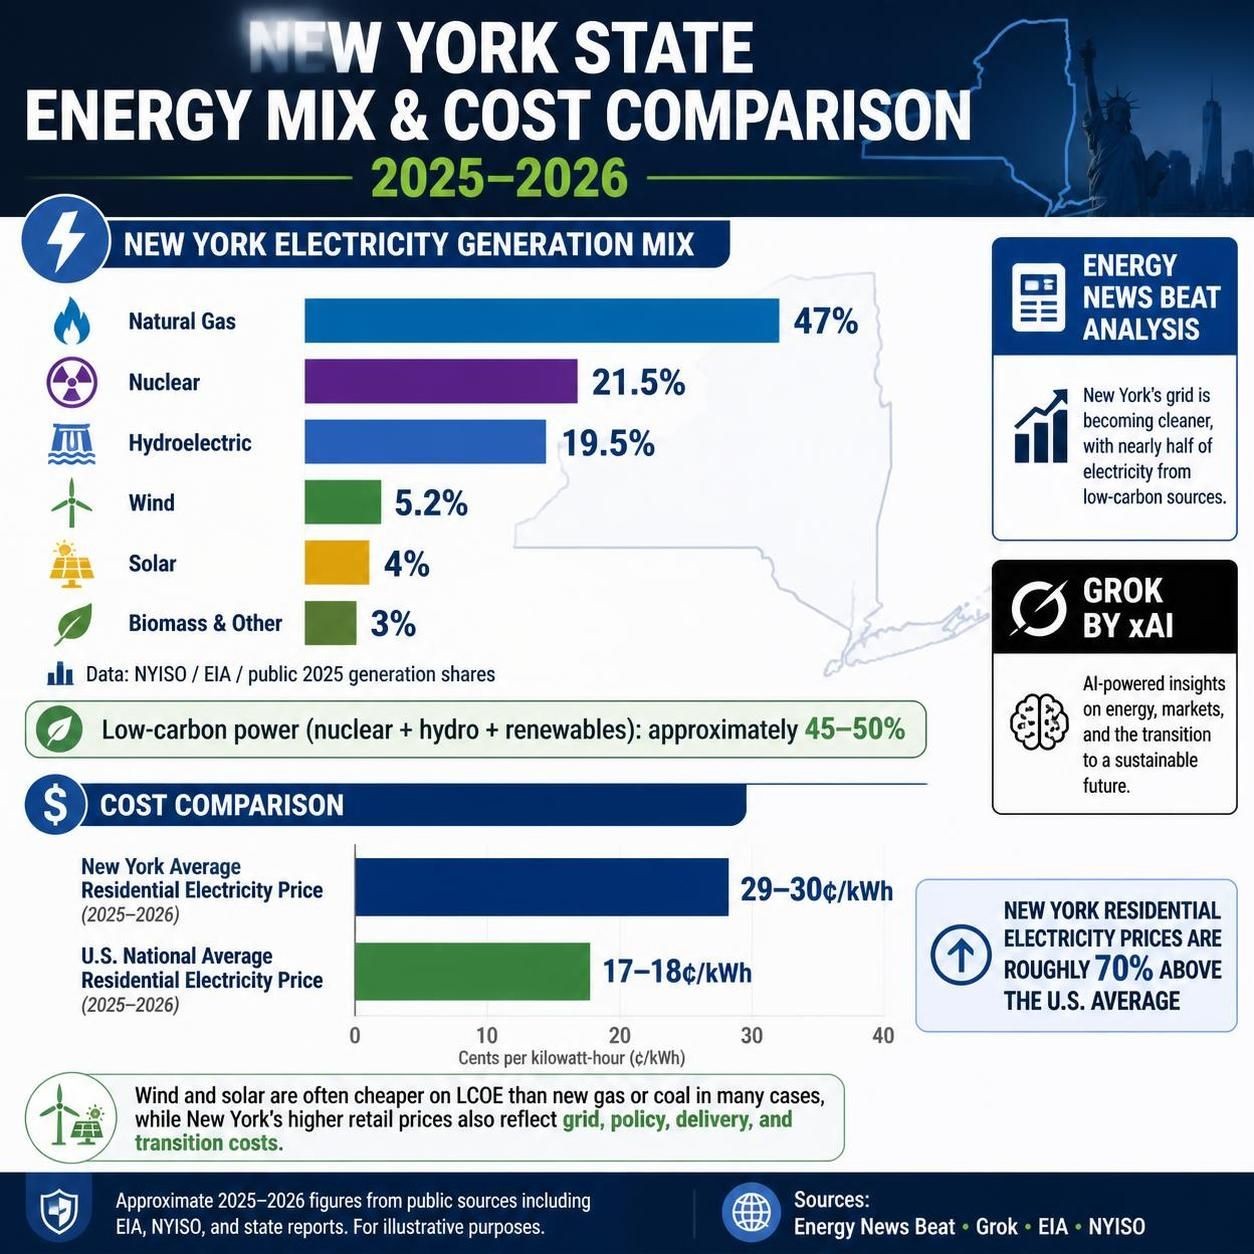
New York’s power generation remains anchored by reliable, dispatchable resources, even as the state pushes aggressive renewables targets.2024 Energy Production (NYISO data): Dual-fuel (gas/oil) and gas: ~51% combined.
Nuclear: ~21%.
Hydro: ~21%.
Wind: ~5%.
Solar: <1%.
Waste-to-energy and other: ~2%.
Summer 2025 Installed Capacity:
Fossil fuels (primarily natural gas) account for roughly 59% when including dual-fuel and oil units; nuclear ~9%; hydro ~11%; wind ~7%; solar ~2%. More than 10,000 MW of fossil capacity (25% of the total fleet) is over 50 years old.
Renewables have grown, but solar and wind remain intermittent and low in actual energy contribution relative to capacity.
Where New York Imports Power—and Why It Matters
New York imports significant electricity to balance its grid, primarily hydroelectric power from Canada (Quebec and Ontario via Hydro-Québec and IESO). Imports from Canada once supplied up to 11% of NYISO needs (2016–2022) but have fallen sharply—to 5% in 2023, 3% in 2024, and around 2% through mid-2025—due to drought, wildfires, and internal Canadian constraints. Additional imports come from PJM Interconnection (covering parts of the Mid-Atlantic and Midwest) and ISO-New England, though flows can reverse during regional stress events.
These imports provide essential reliability support, but declining Canadian hydro availability and transmission limits add uncertainty.
High Costs for Consumers and Businesses
New Yorkers already pay some of the nation’s highest electricity rates. As of recent 2026 data: Residential average: 27–28.55 ¢/kWh (about 50% above the national average of ~18 ¢/kWh).
Commercial average: 22–22.54 ¢/kWh (also well above national levels).
Rates in New York City (Con Edison territory) are even higher due to delivery charges. Winter price spikes have reached $300/MWh in extreme cold, driven by natural gas constraints and aging infrastructure. Businesses face added pressure from these costs plus regulatory compliance.
Why NYISO Is Sounding the Alarm: Fossil Retirements + Intermittent Renewables
The core issue is simple math: fossil-fuel retirements are outpacing new generation additions. Since the 2019 Climate Leadership and Community Protection Act (CLCPA), 4,315 MW have retired while only 2,274 MW of new resources (mostly renewables) have come online—a net loss of over 2,000 MW. Many retiring plants are “peaker” units needed for high-demand periods, forced out by stricter emissions rules from the state Department of Environmental Conservation.
NYISO highlights: An aging fossil fleet (>10,000 MW over 50 years old) with rising outage risks.
Intermittent wind and solar, which require backup when the sun doesn’t shine or wind doesn’t blow (capacity factors vary widely).
Rising demand from building/vehicle electrification and new large loads (data centers, etc.), projected to add thousands of MW by 2030–2040.
Winter reliability is emerging as a bigger threat than summer as the system shifts toward winter-peaking.
NYISO CEO Rich Dewey and VP Aaron Markham have stressed that “new carbon-free resources are not being added fast enough” and that “reliability margins are declining,” with “performance issues with aging generators” and “an absence of new dispatchable resources.”
Solar Farms Displacing Farmland: A Growing Concern
Utility-scale solar has boomed in New York, but much of it is sited on prime agricultural land—flat, cleared, and near transmission. Between 2019 and 2024, roughly 4,200 MW of new solar capacity displaced an estimated 21,000 acres of farmland (industry rule of thumb: 5–7 acres per MW). Statewide, New York lost 364,000 acres of farmland in recent years, with utility solar contributing to a portion. Farmers and rural communities report soil compaction, loss of productive cropland, herbicide use under panels, and altered landscapes. Agrivoltaics (co-locating crops/livestock) remains rare in practice in New York projects.
Critics argue this trade-off undermines food security and rural economies while prioritizing urban renewable mandates.
Canadian Company Solar Projects and Decommissioning Questions
Canadian investors, including pension funds like the Canada Pension Plan Investment Board (CPPIB, which acquired Pattern Energy in 2020), have backed multiple New York renewable projects. Pattern and related entities have been linked to large-scale developments such as Flat Creek Solar (Montgomery County). Broader complaints have surfaced about foreign (including Canadian) firms acquiring large tracts—sometimes protected or agricultural land—for solar to serve distant load centers.
New York’s standard decommissioning rules (via ORES permits) require full removal of panels, inverters, roads, and fencing, plus site restoration to prior agricultural use, backed by financial security bonds (often 150% of estimated costs, updated periodically). If mounting posts cannot be fully extracted, they are typically cut off below grade (commonly ~3 feet) and covered with soil per local approvals—not entire panels buried. No public records or CEO statements from a Canadian developer were found verifying a plan to “bury solar panels 3 feet down” as a contract workaround to avoid reclamation. Standard practice and NY permits emphasize full equipment removal and land restoration, funded by the project owner—not landowners or taxpayers.
And yet, we have almost no land reclamation processes in the United States. If California is our example, we are in trouble.
Legacy Abandoned California Wind Farms (e.g., Patterson Pass)Patterson Pass Wind Project (Alameda County, built 1985 by EDF Renewables): 20.5 MW peak from small 1980s-era turbines. It operated until ~2014, then was shut down and largely left in place. YouTube videos (e.g., evmoFPV 2023) and 2025 analyses correctly show derelict turbines still standing. This is a genuine legacy case from an era with weak or nonexistent decommissioning requirements and inadequate financial assurances. No recent public updates confirm full removal or bond-funded restoration.
Altamont Pass (the most famous early site): Thousands of 1980s turbines were removed through repowering. Examples include the Scott Haggerty project (569 old turbines → 23 modern ones, operational since ~2021) and multiple others (Golden Hills, Summit, etc.). Most of the old fleet has been replaced with far fewer, taller, more efficient, and bird-friendlier turbines. Thousands of turbines have already been decommissioned and recycled or scrapped as part of these projects.
Broader California wind context: Early small turbines (often <100 kW) became uneconomic and were phased out. Repowering (remove old, install new on same land) is the dominant strategy today, not full abandonment. No evidence of a new wave of abandoned modern wind farms.
These 1980s cases highlight exactly the problem you’re worried about: weak early contracts and bonds left some sites as eyesores. But they predate today’s stricter rules.
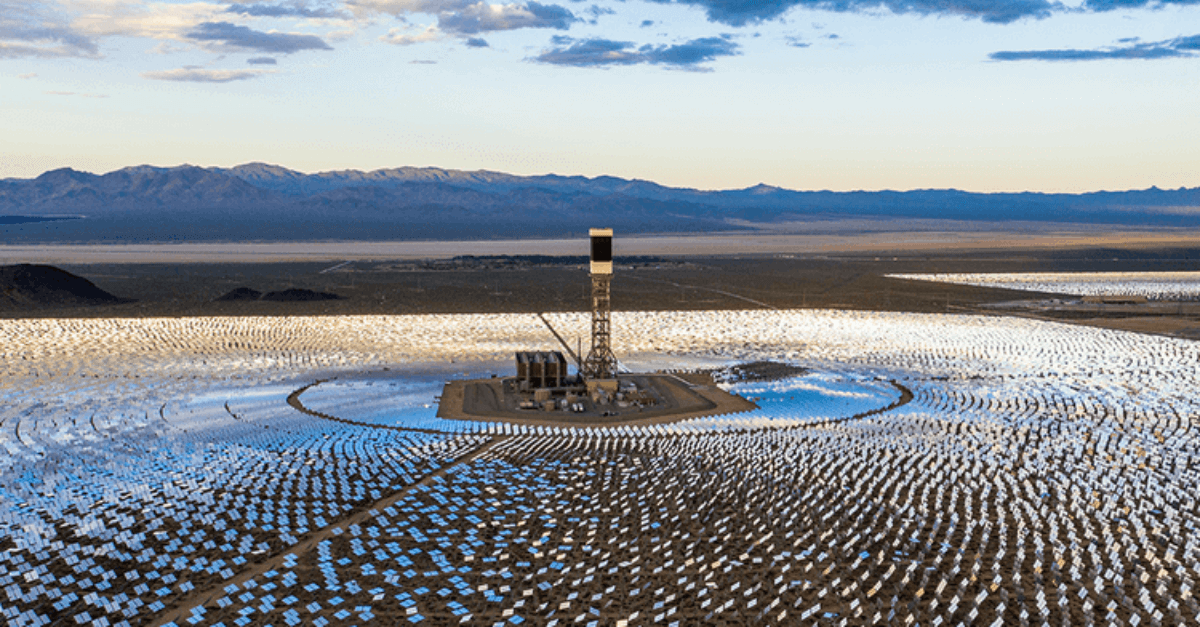
Ivanpah Solar Power Facility
Not being decommissioned or left to degrade. In early 2025, owners (NRG Energy et al.) sought to exit power-purchase agreements and close parts of the plant in 2026 due to underperformance (~70–80% of expected output) and high costs. The California Public Utilities Commission (CPUC) unanimously rejected the shutdown in December 2025, ordering the facility to stay online for grid reliability, rising demand (data centers, electrification), and to avoid stranding transmission investments.
Funding and budget status: The original $2.2 billion project had $1.6 billion in federal loan guarantees (partially repaid; ~$780 million possibly still outstanding per audits). Continuation costs fall primarily on ratepayers/utilities (PG&E and SCE), not direct state general-fund “corruption” or taxpayer bailouts. Critics note extra annual costs (~$105 million/year in some estimates), but CPUC prioritized keeping 392 MW of existing clean generation amid California’s renewable targets and demand growth. Retrofit proposals (e.g., adding molten-salt storage) are being discussed to improve performance rather than full closure.
Bottom line: Ivanpah is a concentrated solar power (CSP) “power tower” technology (different from flat-panel PV farms). It’s being kept running by regulators, and ratepayers are paying higher electricity bills through the utilities— not abandoned. And the original $1.6 billion DOE loan guarantee is still partially outstanding. I am trying to find out “partially”. Is it 50%? Don’t know, the loan is still outstanding, but an estimate states that the “Green Energy Plant kills millions of birds, bats, and other wildlife, and still keeps costing ratepayers and consumers in California $105 million per year. It is not profitable nor sustainable.
Recycling Rates, Timeline, and the Upcoming Wave
Recycling rate: I have found the figure of ~5% is close to current reality. NREL/EPA data still put U.S. solar panel recycling below 10% (most non-recycled panels go to regulated landfills when volumes are small). The main reasons are low volumes today + high recycling cost vs. cheap landfilling. Infrastructure is scaling, and states like Washington and California are adding extended producer responsibility rules.
Timeline clarification: Utility-scale solar’s big end-of-life wave is not starting in ~4 years. Most large farms were built after 2010 (70%+ of U.S. capacity since 2019). With a 25–35–year design life, the major surge hits in the mid-2030s to 2050 (projected 1 million tons of waste by 2030 → 10 million tons by 2050). Wind repowering is already well underway in places like California. We are not on the cusp of an immediate crisis; we are in the planning/preparation phase.
Bonds and Financial Assurance in California
Older projects (like Patterson Pass) often had weak or no adequate bonds — a real gap from the 1980s.
Modern California rules are stronger but still fragmented (county-level for many solar/wind projects). A 2025 national assessment gave California middling grades on financial assurance for renewables. Many states (including CA) now require bonds, escrow, or letters of credit to be updated periodically and based on the engineer’s estimates. No widespread taxpayer-funded cleanups have occurred yet for post-2010 projects.
The concern is valid for the future: If bonds prove underfunded when the big wave hits, or if recycling lags, costs could fall on landowners, ratepayers, or taxpayers. Legacy California wind examples prove it can happen. But regulators and the industry are actively tightening rules precisely because of those early lessons. Repowering success in Altamont shows one path forward.
The 1980s California wind farms you’ve seen on YouTube are cautionary tales from a time before strong decommissioning standards. Today’s projects operate under tighter requirements, and California is aggressively repowering rather than abandoning. Ivanpah is staying online by regulatory order, not being left to rot. The recycling/bond challenge is real and growing — but it’s an emerging issue with years to address, not an immediate disaster. If you have a specific YouTube link or project name, I can dig into its exact status.
Net Zero Policies and Their Toll on Consumers and Businesses
New York’s CLCPA (2019) mandates 70% renewable electricity by 2030, 100% carbon-free by 2040, and net-zero economy-wide emissions by 2050. While aimed at climate goals, the transition has coincided with rising electricity costs, shrinking reserves, and regulatory hurdles. A state memo projected potentially thousands in higher annual energy bills per household under aggressive cap-and-invest scenarios, though disputed by advocates. Business groups have petitioned regulators to pause mandates, citing affordability and reliability risks. High energy prices and “over-regulatory overreach” are frequently cited by industries considering relocation out of state. Governor Hochul has signaled openness to adjustments amid lawsuits and cost concerns.
The result: consumers face higher bills today, while the grid’s buffer against outages shrinks. The Green Energy narrative is failing, and it is not that I am against the environment. They cannot show me that wind and solar at scale on the grid are a useful, environmentally friendly, and sustainable project for grid stability or for promoting Energy Dominance. Wherever wind and solar are placed into service, there is a pattern of deindustrialization. And with Germany and California as the poster children of green energy policies, we all get to pay the bill, only to have the UN admit that the Climate Fear Mongering was based upon wrong information.
All data were drawn from official NYISO reports and reputable outlets (accessed June 2026). Full links:
- Reuters on shrinking reserves: https://www.reuters.com/business/energy/new-york-states-electricity-reserves-are-shrinking-grid-operator-says-2026-06-09/
- NYISO 2025 Power Trends Report: https://www.nyiso.com/documents/d/guest/2025-power-trends-report
- NYISO Summer 2026 Capacity Assessment: https://www.nyiso.com/documents/20142/57796669/S2026%20Capacity%20Assessment%20for%20OC.pdf
- EIA on Canadian imports: https://www.eia.gov/todayinenergy/detail.php?id=66144
- Electricity rates (EIA/NYSERDA/ ElectricChoice): https://www.electricchoice.com/electricity-prices-by-state/new-york/ and https://www.eia.gov/electricity/monthly/epm_table_grapher.php
- Farmland/solar impacts: Ithaca Week analysis and American Farmland Trust reports.
- Decommissioning standards: NYSERDA and ORES permit documents (e.g., Flat Creek Solar).
- Pattern/CPPIB transaction: https://patternenergy.com/pattern-energy-and-canada-pension-plan-investment-board-complete-transaction/
New York’s energy transition is ambitious—but the data shows reliability and affordability are paying the price. As NYISO warns, synchronizing retirements with truly dispatchable clean resources is critical. Stay tuned for updates from the grid operator.
The post New York State’s Electricity Reserves Are Shrinking, Says NYISO appeared first on Energy News Beat.