
As of early November 2026, U.S. drilling activity shows modest weekly stability or small declines depending on the source, set against a solidly higher year-over-year base. Baker Hughes reported its closely watched weekly rotary rig count at 603 for recent weeks ending in late October (unchanged week-over-week and up roughly 53 from about 550 a year earlier). WellDatabase’s U.S. Rig Report dated 11.1.2026 showed 606 total rigs (down 3 week-over-week but up 54 year-over-year). Enverus’ daily GPS-tracked Daily Rig Count stood near 645 as of October 28 (down about 3% from the prior week), consistent with its broader capture of the active fleet.Petroleumnews
These three sources use different methodologies. Baker Hughes provides the traditional weekly rotary census (land, inland water, and offshore) that markets follow most closely. WellDatabase cross-references Baker Hughes data with permit records to deliver granular operator, state, basin, well-type, wellbore, and depth breakdowns. Enverus tracks a higher share of the fleet in near real time via GPS, which almost always produces a higher headline number. Together they paint a picture of flat-to-modestly softer weekly movement on an elevated year-over-year base, with oil-directed activity still leading.
Baker Hughes Review
Baker Hughes’ U.S. rotary drilling rig count held at 603 for multiple consecutive weeks into late October 2026 (weeks ending October 16, 23, and 30), the first sustained period in the 600s since May 2024. The count is up by about 53 from 550 a year earlier.Petroleumnews
For the week ending October 23: oil-directed rigs were 460 (+1 week-over-week, +40 year-over-year from 420), gas-directed were 132 (−1, +11 from 121), and miscellaneous were 11 (unchanged, +2). Horizontal rigs totaled 528 (−9 week), directional 54 (+11), and vertical 21 (unchanged). By the week ending October 30, oil rose further to 462 (+2) while gas fell to 130 (−2), with the total still flat at 603 and miscellaneous at 11. Year-over-year gains remain solid (oil up roughly 40–48, total up 53–57 depending on the exact comparison week).Aogr
State-level movement (week ending October 23 examples): New Mexico +2 to 98, Louisiana +1 to 41, North Dakota +1 to 32; Texas −1 to 277, Utah −2 to 18, Colorado −1 to 11. Other states were largely unchanged (Oklahoma 50, Pennsylvania 15, Alaska 12, Wyoming 16). The Permian held at 272 (unchanged, up ~21–22 year-over-year). Haynesville and Eagle Ford saw minor weekly fluctuations around the mid-50s and ~50, respectively. Canada was in the 220–226 range in recent weeks.Worldoilmonitor
Enverus Review
Enverus’ Daily Rig Count, which uses GPS tracking for near-real-time coverage of a broader active fleet, printed 645 as of October 28, 2026, down roughly 3% week-over-week. Daily and basin snapshots in late October showed totals ranging from the mid-640s to mid-660s. Basin examples from late October: Permian around 242–257 (modest recent softness), Gulf Coast (including Eagle Ford) near 73, Williston ~36–37, Anadarko ~61–66, Appalachia ~33, DJ ~10, and a large “Other” category near 188. Month-over-month the total was down about 1.5% in one late-October read, but year-over-year gains remained in the low-to-mid teens percent range on public snapshots.App.drillinginfo
Enverus Drilldown Report averages around mid-October showed U.S. active rigs near 657 (land-heavy), with private operators continuing to drive a disproportionate share of recent growth in prior analyses. The higher Enverus total relative to Baker Hughes and WellDatabase is structural and expected given the GPS methodology.
WellDatabase Basin and State Specifics
WellDatabase’s November 1, 2026 report shows 606 total rigs (−3 week, +54 year). Oil wells: 434 (+2 week, +47 year from 387). Gas: 126 (−2, +1 from 125). Undisclosed 35 (−3), thermal 10 (unchanged), unknown 1. Horizontal wellbores dominate at 499 (−1), with vertical 55 (−2) and directional 50 (−2). Depth ranges are concentrated in the 10k–15k ft (243) and 5k–10k ft (120) buckets, with >20k ft at 113 (+1).
Key basins (current / week change / year change):
- Permian: 272 / 0 / +21 (from 251)
- Haynesville: 55 / −1 / +15 (from 40)
- Eagle Ford: 50 / −1 / +7 (from 43)
- Williston: 39 / −3 / +3 (from 36)
- Marcellus: 23 / 0 / 0
- Granite Wash: 22 / 0 / +8 (from 14)
- Cana Woodford: 18 / 0 / −3 (from 21)
- Other: 104 / +2 / +12 (from 92)
- Utica: 10 / 0 / −4 (from 14)
- DJ-Niobrara: 9 / 0 / −1
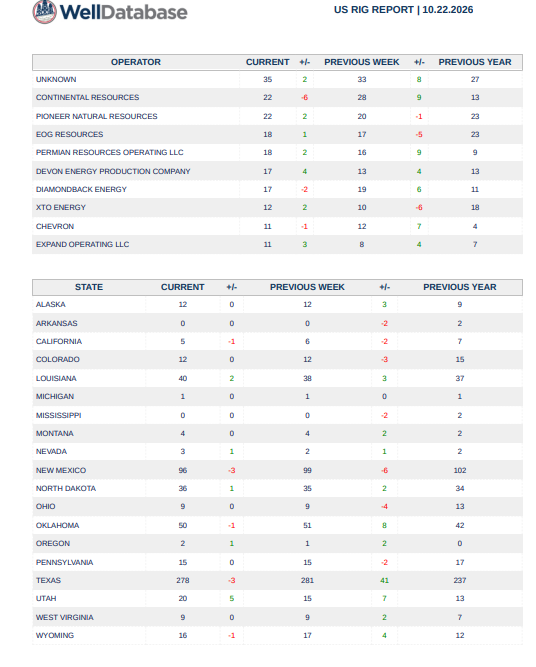
Key states: Texas 275 (−2 week, +40 year from 235), New Mexico 99 (+1, −4 from 103), Oklahoma 50 (0, +8 from 42), Louisiana 41 (0, 0), North Dakota 35 (−3, 0), Wyoming 18 (+2, +5 from 13), Utah 17 (−1, +4 from 13), Pennsylvania 15 (0, −2), Alaska 12 (0, +3 from 9), Colorado 11 (0, −2). Top operators include Unknown (35), Continental Resources (20), Devon Energy (20, −1), Diamondback Energy (20, +1), Pioneer Natural Resources (18, −1), EOG Resources (16), Permian Resources Operating (16, +1), Mack Energy (13), Chevron (11), and Comstock Oil & Gas (11, +3).
The report’s map and 12-month charts show concentration in the Permian and other oil-weighted areas, with overall activity elevated versus late 2025.
SPR and Distillate Inventories
The Strategic Petroleum Reserve stood at approximately 282.6 million barrels in the EIA weekly report covering the week ending October 23, 2026 (down modestly on the week). This is near multi-decade lows (lowest since the early 1980s in some series) after significant draws earlier in 2026 tied to geopolitical supply disruptions and loan/release activity. Commercial crude stocks were around 410.6 million barrels (−1.9 million week-over-week). Refinery inputs remained solid near 16.5 million barrels per day in recent reads.Worldmonitor
U.S. distillate fuel oil stocks (including diesel and heating oil) were 102.8 million barrels as of the week ending October 23, 2026 (down about 1.5 million week-over-week). This is well below the five-year average (roughly 114 million barrels) and roughly 9–11% below year-ago levels, keeping the market tight. Days of supply hovered near 25–26. East Coast (PADD 1) inventories were particularly lean. Gasoline stocks rose on the week in the same report. These inventory levels support elevated product prices and underscore the importance of continued domestic drilling and production response even as weekly rig counts flatten.Pier20
Takeaway
The three rig-count series align on a higher year-over-year floor (roughly +50–70 depending on source and methodology) with oil leading and the Permian dominant. Weekly prints are flat to slightly softer. Tight distillate stocks and multi-decade-low SPR levels keep the focus on supply security amid elevated commodity prices. Efficiency gains continue to allow higher production with fewer rigs than historical peaks, but the elevated activity base supports ongoing growth.
We highly recommend using WellDatabase and their subscription!
Appendix: Sources and Links
- WellDatabase U.S. Rig Report | 11.1.2026: Total 606 (−3 week, +54 year); detailed state, operator, well-type (Oil 434 / Gas 126), wellbore, depth, and basin tables. Methodology: Baker Hughes cross-referenced with permit data. (Attached report.)
- Baker Hughes U.S. Rig Count: 603 (unchanged recent weeks ending ~October 23–30, 2026; +53 year-over-year). Oil ~460–462, gas ~130–132. Permian 272. Official overview: https://bakerhughesrigcount.gcs-web.com/rig-count-overview/. Reporting: https://www.petroleumnews.com/story/2026/11/01/e-and-p/baker-hughes-us-rig-count-unchanged-at-603/50476.html, https://www.aogr.com/web-exclusives/us-rig-count, https://rbnenergy.com/daily-posts/analyst-insight/us-rig-count-unchanged-third-straight-week-603-niobrara-leads-gains, https://www.oilandgas360.com/baker-hughes-rig-count-10-30/.[](https://www.petroleumnews.com/story/2026/11/01/e-and-p/baker-hughes-us-rig-count-unchanged-at-603/50476.html)
- Enverus Daily Rig Count: ~645 as of October 28, 2026 (−3% week). Basin snapshots available on the platform. https://app.drillinginfo.com/drc/ and https://www.enverus.com/dailyrigcount/. Related Drilldown and Intelligence Research notes.App.drillinginfo
- EIA Weekly Petroleum Status Report (week ending October 23, 2026, released October 28): Commercial crude ~410.6 million barrels; SPR ~282.6 million barrels; distillate ~102.8 million barrels. https://www.eia.gov/petroleum/supply/weekly/. Supporting data: https://www.eia.gov/dnav/pet/pet_sum_sndw_a_epd0_sae_mbbl_w.htm, https://ycharts.com/indicators/us_ending_stocks_of_distillate_fuel_oil.[](https://pier20.com/benchmarks/us-distillate-inventories)
- Additional context: Prior Energy News Beat three-source comparisons at energynewsbeat.co (tag: WellDatabase). NOV Rig Census and other industry notes for fleet context.
Data as of early November 2026. Weekly figures can shift with the next Friday Baker Hughes release and Wednesday EIA report.
The post U.S. Weekly Rig Count: Comparing Enverus, Baker Hughes, and WellDatabase — Flat Weekly Activity Against Year-Over-Year Gains as SPR Hits Multi-Decade Lows and Distillates Stay Tight appeared first on Energy News Beat.