
Crude is not scarce. Diesel out of the Atlantic basin is — and the refineries that could make it are not where the barrels are, or configured to run them. American margins are near records while Asian margins have collapsed, and that gap is doing more to set the price at your pump than the price of oil.
By Energy News Beat | Nov. 1, 2026 | U.S. Energy Information Administration daily spot and weekly petroleum data through Oct. 27; OPEC World Oil Outlook 2026; IEA Oil Market Report, October 2026; China General Administration of Customs, September 2026; Kpler and Vortexa; European Commission and Council of the European Union, Oct. 28-29; U.S. Treasury and Federal Register. All sources accessed Nov. 1, 2026.
The hook: Russian crude sells at a premium now
For four years the story of Russian crude was discounts — barrels Europe would not buy finding their way east at a markdown. That story is over, for now. Sellers were asking $26 to $27 a barrel over ICE Brent for November and December ESPO Blend, and a deal by a large independent Chinese refiner was heard at $23 to $26. In early September the premium was more than $7, then called a record. Six weeks later it had more than doubled.
Yulong is described two ways in the record and both are correct. Reuters puts capacity at 400,000 barrels a day. EIA’s refining outlook describes the fuel output as about 100,000 barrels a day of transportation fuels, with the balance to naphtha and petrochemical feedstocks. The 400,000 is crude throughput at Yantai; the 100,000 is fuel yield. A difference in basis, not a disagreement, and why the plant does not behave like a 400,000 barrel a day fuels refinery.
What replaced the discount is scarcity of one specific thing. Chinese demand for Russian crude is concentrated — Sinopec and a Shandong complex called Yulong take most ESPO cargoes out of Kozmino, and their competition is one of the pressures traders cite. But the deeper cause is what China lost. Iranian crude is gone from its import book, and something had to fill the hole.
And the premium is already coming off. Kommersant, citing S&P Global, reported on Oct. 26 that the ESPO premium for delivery into Shandong fell $10 over the month to $20 a barrel against ICE Brent by Oct. 23. Vortexa shows why: Middle East shipments to China excluding Iran reached 4.5 million barrels a day in October, near the 2025 average of 4.7.
Freight turns faster still. Aframax rates from Kozmino to China surged to $10 million a voyage in October before falling to about $2 million. Sergei Frolov of NEFT Research told Kommersant the offers were an attempt to lock in margin while Middle East tension held, and doubted they would last. Reuters had assessed $12 premiums for November cargoes in September. Russian crude trades at a premium, and that premium is fading as freight normalises — what you would expect if crude was never the problem.
Same barrel, two basins, two different worlds
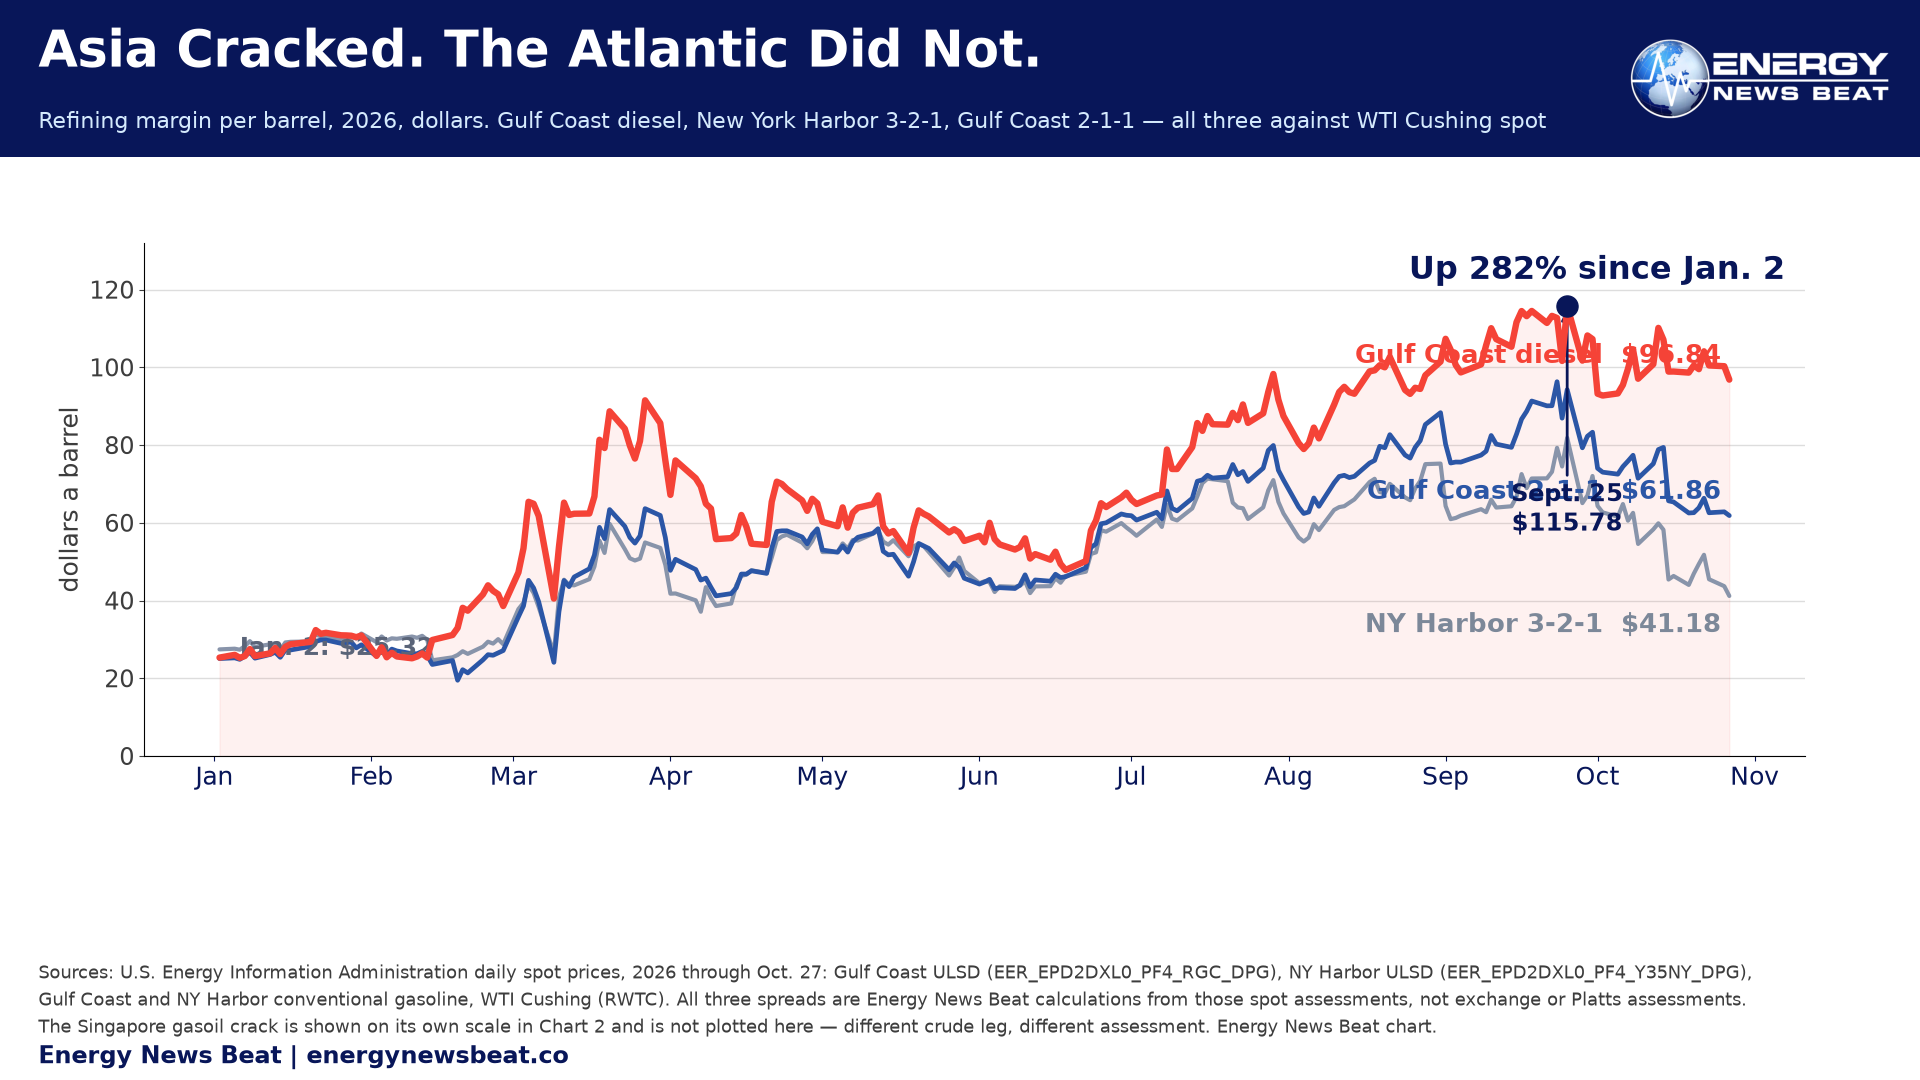
Now hold that next to the refining margins. On Oct. 27 the Gulf Coast diesel crack — ULSD against WTI, both EIA spot assessments, a subtraction any reader can reproduce — was $96.84. It is a diesel-only margin, not a blended one. The Gulf Coast 2-1-1 was $61.86 and the New York Harbor 3-2-1 $41.18, higher than 96 percent of sessions since 1986 according to The Vault Report.
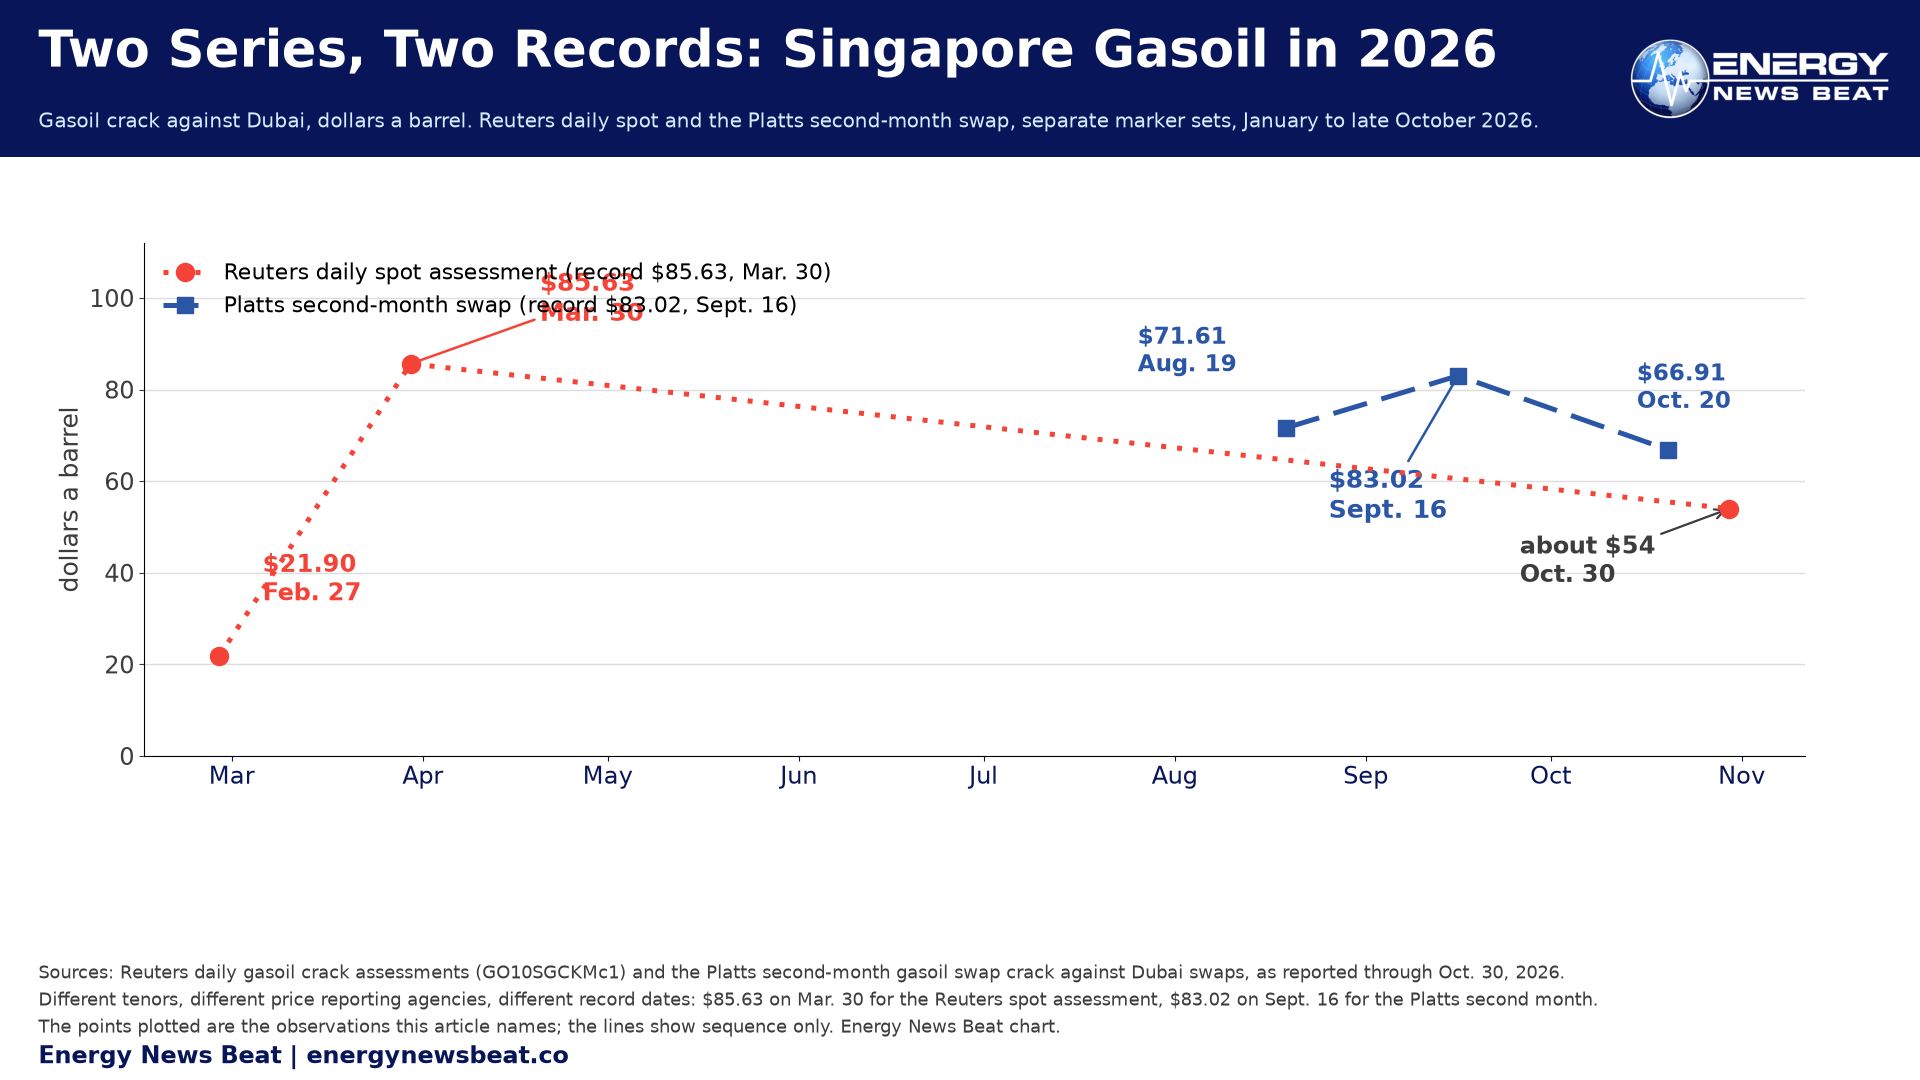
Then look east. The Singapore gasoil crack against Dubai held just above $54 on Oct. 30, a three-month low. Its record is $85.63, set March 30; on Feb. 27, the last session before the war, it was $21.90. Singapore has fallen hard and still sits near 2.5 times where it started. Asia cracked. The Atlantic did not, and crude does not explain it.
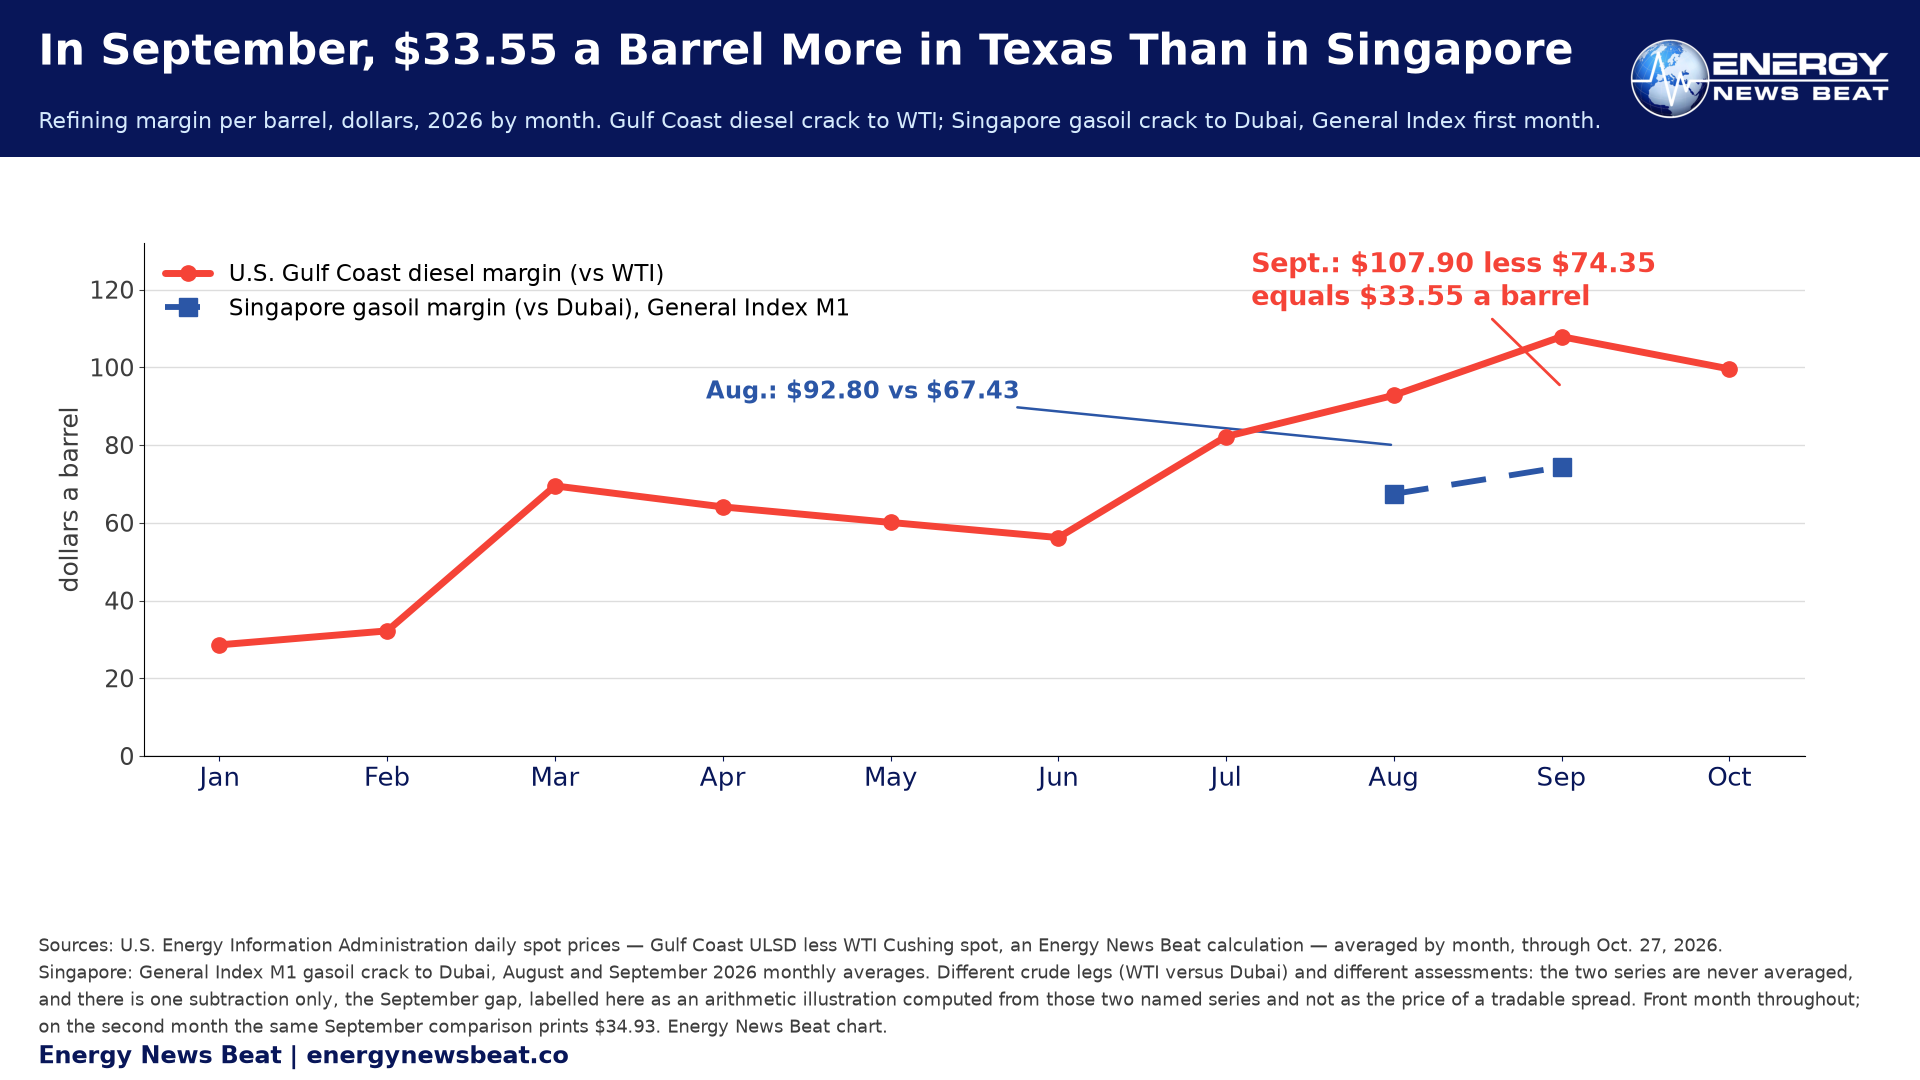
Platts assesses a second Singapore series, the second-month gasoil swap crack against Dubai swaps, and this piece has to show both. On the Platts basis the crack averaged $64.71 in August and $72.97 in September, against a 2025 average of $18.16, with a $83.02 record on Sept. 16 and $66.91 on Oct. 20. The two families therefore carry different records on different dates. Neither is the record unless the series is named, and the two are never averaged.
Platts called $71.61 on Aug. 19 a record high, then superseded it at $83.02 four weeks later. A third figure, $74.35, circulates as a September average. It is the M1 gasoil crack to Dubai, against $67.43 in August, from General Index — a different tenor, not interchangeable with the second-month swap. $18.16 is a 2025 annual average, the pre-war print is $21.90 on Feb. 27, 2026.
And the $100-plus figures were not the Singapore gasoil crack at all. $102.20 on Aug. 17 was the U.S. diesel crack against WTI, a different market on a different crude leg. Jet fuel margins did separately exceed $100 in early March. Both are true; they are not the same statement.
What is scarce is yield, not capacity
Capacity is not the constraint. OPEC puts crude distillation capacity at 103.3 million barrels a day as of January 2026, running at 80.8 percent utilisation in 2025, with 5.3 million barrels a day coming through 2030 against 0.3 of closures. There is headroom in the aggregate, and it sits in the wrong hemisphere: the same OPEC table puts Africa at 55.1 percent utilisation in 2025, Latin America at 59.1 and the Middle East at 76.5, against 93.8 in the United States and Canada and 82.9 in Europe. The squeeze is in what comes out the far end: OPEC puts 2026’s global addition to potential product output at 1.0 million barrels a day, of which middle distillates are 0.4 — a modelled figure at an assumed 90 percent run rate, not observed production. That 0.4 is the shortage.
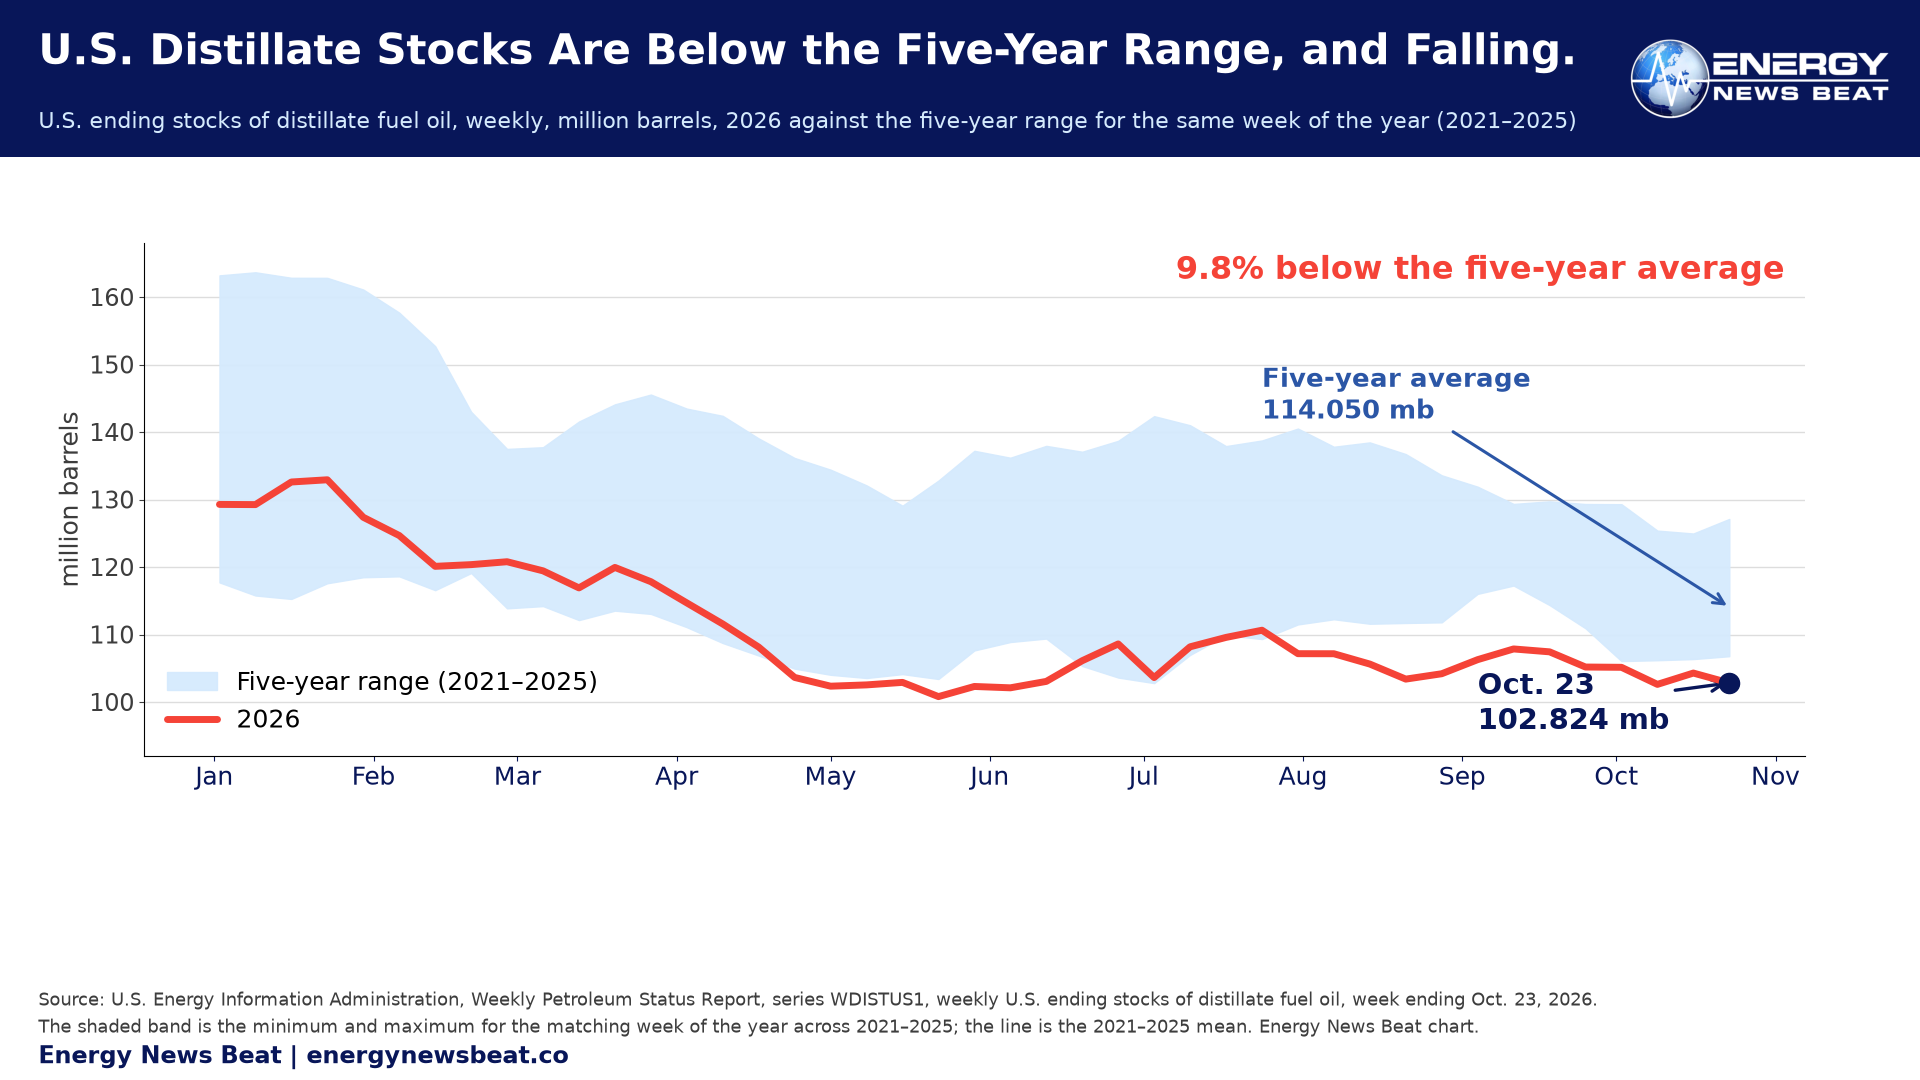
The United States is the proof. Refiners ran above 95 percent of capacity between May and September, the highest for those months since 1998, yet total output was only the highest since 2019 because capacity has fallen 4 percent. Running flat out on a smaller base does not make more fuel. Distillate stocks were 102.8 million barrels in the week to Oct. 23, about 9.8 percent below the five-year average; East Coast inventories were 32 percent below seasonal norms in September, and that is the region setting the New York Harbor price.
Crude itself agrees. Saudi Arabia cut November Arab Light to Asia to $5.00 under Oman/Dubai, the widest since June 2020. Roughly 13 October-loading Angolan and Nigerian cargoes were still unsold, Angola’s Hungo traded at $19.60 under Dated Brent — the widest for any West African grade in fifteen years — and Vortexa counted 415 laden VLCCs, the most since November 2025. Crude is in the Atlantic, at a discount, going nowhere, while the product made from it does not follow it down. That is the trap.
The counterargument, which is good
The best case against this comes from the IEA. It blames delivered crude cost, not plant capability: “Record freight and crude costs crushed margins in Europe and Asia, while discounted feedstocks propelled US margins to new highs.” A refinery that cannot earn a margin because the barrel costs too much to reach it is not one that cannot run.
The freight numbers back it. On Valero’s third-quarter call, executive Randy Hawkins said moving a VLCC from the Gulf Coast to Asia was “averaging around 30 to $35 per barrel” against a “2025 average of around $5.” Vortexa independently puts Gulf Coast to Ningbo at $35 in October, up six-fold. If the IEA is right, the cure is cheaper freight, not more refineries. Both can be true in part: freight explains much of the divergence but not all, because Asia runs the same crude and its margin collapsed while the Atlantic’s did not.
China rebuilt its book
China is where the barrels went. September imports were 37.096 million tonnes, about 9.03 million barrels a day — a conversion, not a customs publication: 37.096 divided by 30 days times 7.30 barrels a tonne gives 9,027 thousand barrels a day. Vortexa put September seaborne arrivals at 7.6 million barrels a day, down from 9.9 a year earlier. The gap is definitional, seaborne against total including pipeline, not a conflict. Kpler expects the fourth quarter at 8.0 to 8.5 million barrels a day.
The customs detail is where the rebuilding shows. Russia supplied 2,419 thousand barrels a day in September, Brazil 1,252 and Iraq 1,177 — together slightly more than half of the month’s imports. But the two lines that carry the story are Saudi Arabia at 657 thousand barrels a day, down 62 percent from a year earlier, and Malaysia at 282 thousand, down 70 percent, which is the label much Iranian crude has travelled under. Customs recorded no crude imports at all from the United States, Venezuela or Iran, the same as a year earlier. Over nine months Brazil overtook Saudi Arabia as China’s second-largest supplier, 44.29 million tonnes against 43.12.
Iran is the one to be careful with, because a loading and an arrival are different dates. Loadings dried up in late August: Kpler reports no crude or condensate cargo loaded since Aug. 25. Cargoes booked earlier kept discharging through late September, so Vortexa still counts about half a million barrels a day of Iranian arrivals in the month, from 980,000 in August, the last landing on Sept. 26. By mid-October the oil on water outside the blockade zone had fallen to zero from 88.8 million barrels on July 14. Arrivals lag loadings by weeks: a zero in the loading column and half a million a day in arrivals are one fact seen twice.
On September stock draws the two houses now publish totals directly, and they agree on the direction. Reuters reports that Vortexa recorded a 57 million-barrel draw in onshore crude inventories, while Kpler recorded 47.5 million, and that both are the biggest monthly draw in each house’s series — Vortexa’s since 2019, Kpler’s since 2017. Both are named and neither averaged; each measures onshore stocks over one month.
Kpler’s other detail complicates anyone claiming China is draining its reserves. China still held 1,124 million barrels in storage, about 80 days of refinery requirements, and the drawdowns were concentrated in commercial inventories, with strategic reserves largely untouched. September throughput rebounded to 14.05 million barrels a day from 13.46 in August, and the 1.6 million barrel a day draw was more than twice the May to August rate and above Kpler’s previous record, 950,000 barrels a day in October 2017. China has drained tanks its refiners own, not the state’s.
One caveat has a date. Vortexa expects October seaborne imports near 8.8 million barrels a day, up from a Q3 average of 7.5 but still well below the 2025 average of 10.6. A recovering China is not a restored China. Every October China figure here is a tracker estimate, and China customs publishes October on Nov. 10. That release is the test of the “China is back” claim.
When China releases product, Asia cracks fall
Watch what Beijing did in October, because it is the mechanism in miniature. Vortexa noted on Oct. 20 that the final clean fuel export quota batch had been cut 55 percent year on year to 4.55 million tonnes, with the annual quota broadly stable around 41 million tonnes since 2023. The same note flagged the other direction: if Middle East crude supply stayed robust, Beijing could issue up to an additional 4 million tonnes.
Eight days later, it did. Reuters reported on Oct. 28 a surprise fourth batch of about 3.7 million tonnes, with one source saying nearly 4, taking the 2026 total to roughly 40 million tonnes. Two days later the same wire had an allowance making the 2026 total 6 percent higher than last year, where its Oct. 28 copy framed the total as matching 2025. The direction is not in doubt; the base-year arithmetic is, so the 6 percent is attributed to its date. A cautious cut, a flagged possibility, then the release: a government working a valve, not a market discovering a shortage.
The product market repriced within two days. Reuters reported on Oct. 30 that the Asian gasoline margin more than halved to about $11 a barrel over Brent, the lowest since March, from a record $50.53 on Oct. 1. Singapore light distillates rose to a two-week high of 11.304 million barrels in the week to Oct. 28, gasoline imports more than doubling to 314,000 tonnes while exports fell about 40 percent.
Sparta Commodities put the remaining problem at roughly 6 million tonnes a month of exports in November and December to use the full quota, against about 3.8 million in October, and argued China probably will not get there. Sparta called the dip in Singapore gasoil cracks a buying opportunity. A quota is permission, not a cargo; permission never lifted is not supply.
Asia has a release valve, and it worked within days. The Atlantic has no equivalent: no government can release refining capacity that does not exist, and no quota can be issued for a distillation column. That asymmetry is why the Gulf Coast diesel crack was still $96.84 on Oct. 27 while Singapore had come down to about $54. The difference is where product can be made, moved and permitted out. Vortexa expects China’s seaborne clean fuel exports to average around 650,000 barrels a day in the fourth quarter, down from September’s three-year high of around 1 million.
What the curve says about your fuel bill
The futures market says prices come down, and says next year. Brent for December 2026 settled at $117.64 on Oct. 30, the day it expired. January 2027 was $113.43, June $98.22 and December 2027 $88.11 — a gap of $29.53 from the expiring contract to year-end, steep backwardation.
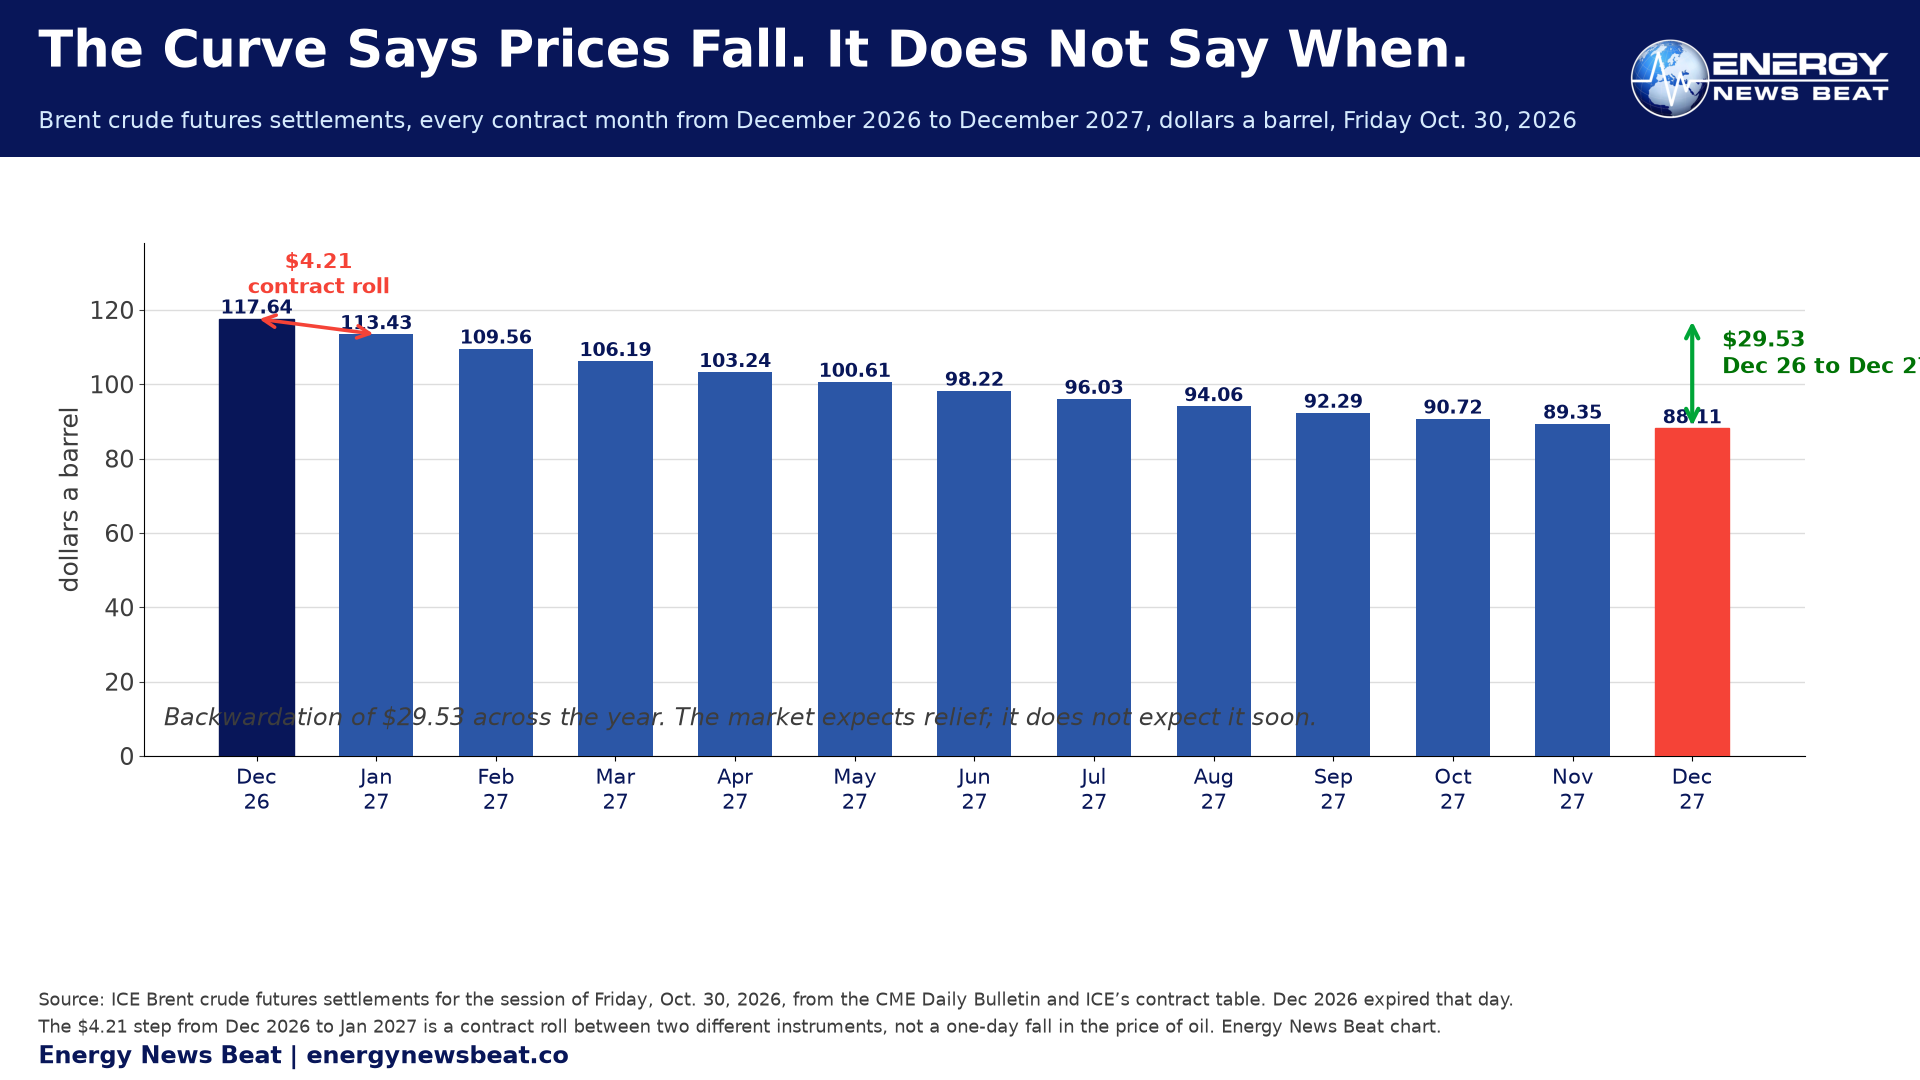
Now the trap. The move from $117.64 to $113.43 is not a $4.21 fall in oil. It is a $4.21 contract roll: December expired and January became the front month. Some providers have rolled their front-month series, some have not, so two numbers circulating as today’s price can be two contracts.
Keep spot and futures apart too. EIA’s Dated Brent spot was $123.10 on Oct. 27. On Oct. 15 Platts assessed Dated at $125.98 while futures settled $105.92, a 19 percent premium for a barrel you could actually have; on Oct. 5 Dated topped $154 intraday. That gap is the physical market saying the barrels are not where they are needed. The IEA is warier than the curve: higher refinery output returns gasoil to surplus in early 2027, it says, “however, this will be insufficient to offset the deficit accumulated during 2026.” The balance stays tight “well into 2027” and depends on Middle East product supply recovering.
The other release valve is a stock draw, and it is not a refinery either. On Oct. 2 the G7 announced a coordinated IEA release of up to 100 million barrels over four months, frontloading diesel into the first 20. Euronews reported on Oct. 8, from an internal document, that the pledge largely completes the unfinished March 2026 IEA release: of 400 million barrels pledged in March, 326 million had been released. On Oct. 29 the Energy Department said companies had agreed to borrow more than 40 million barrels from the Strategic Petroleum Reserve, the U.S. share. Neither makes diesel. Both buy time; neither adds a distillation column.
Europe is reversing a direction, not yet a fact
Two of Stu’s arguments get tested here and the honest answer on both is “partly.” The first is that blue states follow Europe’s lead. The European rethink is real: on Oct. 28 the Commission launched a High-Level Dialogue with refining, co-chaired by Dan Jørgensen and Defence Commissioner Andrius Kubilius with NATO in the room. Jørgensen: “We will work to increase outputs from refining assets in Europe, because ultimately, we need to bring fuel prices down.” Six states — Bulgaria, Czechia, Hungary, Italy, Poland, Slovakia — argued the next day that “Crude oil cannot substitute for diesel or aviation fuel without suitable processing capacity.” That is the yield thesis in a government document, presented rather than adopted.
No European crude refinery that actually shut has restarted in 2026. The headlines are maintenance recoveries at plants that never stopped — Kralupy, Porvoo, Pernis, Cartagena, and MOL’s fire-damaged AV3, rebuilt at full capacity with MOL stating the rebuild added none. The best counter-example is Gelsenkirchen. BP twice reversed plans to close units there — a 70,000 barrel a day crude unit and a 40,000 barrel a day vacuum unit, the second time while it looked for a buyer — because tight European diesel made them worth running, then sold the refinery to Klesch, completing on Aug. 3, 2026. Capacity kept alive by the very tightness this article describes, then changing hands rather than closing. And Ludoil’s €1.3 billion plan for ISAB names decommissioned units with no date.
The complication is that urging states to copy Europe would have them adopt what Washington already has. On Oct. 22 the President signed Presidential Determination 2027-01, designating domestic refining capacity as essential to national defence under the Defense Production Act, with up to $150 million proposed and no awards yet. Chris Wright made the same case on television: “its global refining capacity is why gasoline and diesel prices are high, even more than oil prices.” That is Jørgensen’s argument in Washington, and it leaves the question open: why urge states to copy what Washington has already begun?
Iraq: what the record shows, and what it does not
The second needs to be reported as an open question. Stu holds that the war Iran War will not end until Venezuela-style oil controls are placed on Iran. This is based upon the fact that Iraq’s money is controlled through the Federal Reserve and enforcement through the Treasury as noted below. Searches for an escrow, a revenue-sharing arrangement or a Treasury-directed account found none. The proceeds sit in a Central Bank of Iraq account at the Federal Reserve Bank of New York, in Iraq’s own name. The specific post-2003 shield that account once relied on, section 1 of E.O. 13303, was terminated by E.O. 13668 in 2014, an order that named the Central Bank of Iraq accounts expressly; what remains is ordinary sovereign immunity “under otherwise applicable law.” The order ended the protection; the regulation followed. OFAC deleted 31 CFR 576.206, which had carried the shield for the Development Fund for Iraq, Iraqi petroleum proceeds and the Central Bank of Iraq accounts, by final rule on Dec. 28, 2017. What holds Iraq is operational, which is leverage, not control.
But the second half is substantially right. In April the Treasury blocked a shipment of nearly $500 million in banknotes from Iraqi oil revenue, and the Fed cancelled at least two cash shipments on Treasury’s instruction. Deliveries stopped in late February and resumed in late June only after Baghdad agreed to new controls on dollar flows to Iran-backed groups.
What happened to Iraqi oil runs the other way. Crude kept flowing to China, 1.18 million barrels a day in September, with Vortexa expecting about 1.1 million in October. And the one U.S. action against an Iraqi oil official cuts against the thesis. On May 7 Treasury sanctioned Deputy Oil Minister Ali Maarij Al-Bahadly under E.O. 13902, the Iran authority rather than an Iraq-controls authority, for materially assisting a sanctioned smuggler: he granted that network export rights, authorised trucking of oil to a terminal at Khor Zubayr, and falsified provenance so Iranian crude blended with Iraqi could be sold as Iraqi. That is a legal action against a person for moving barrels, not a control over the barrels.
What this means at the pump and in the basement
Start with the question people ask. Will prices come down? On the evidence, yes, and not soon. EIA’s annual average for retail diesel is $5.19 in 2026 and $4.49 in 2027, a 70-cent fall arriving across four quarters rather than four weeks; the September print was $6.29 a gallon, which is the level people are paying now. Brent goes from $105 in the fourth quarter of 2026 to $84 across 2027, and the curve agrees: $29.53 of backwardation from the expiring December contract to December 2027. Direction is not the hard part. Timing is, and it is counted in quarters.
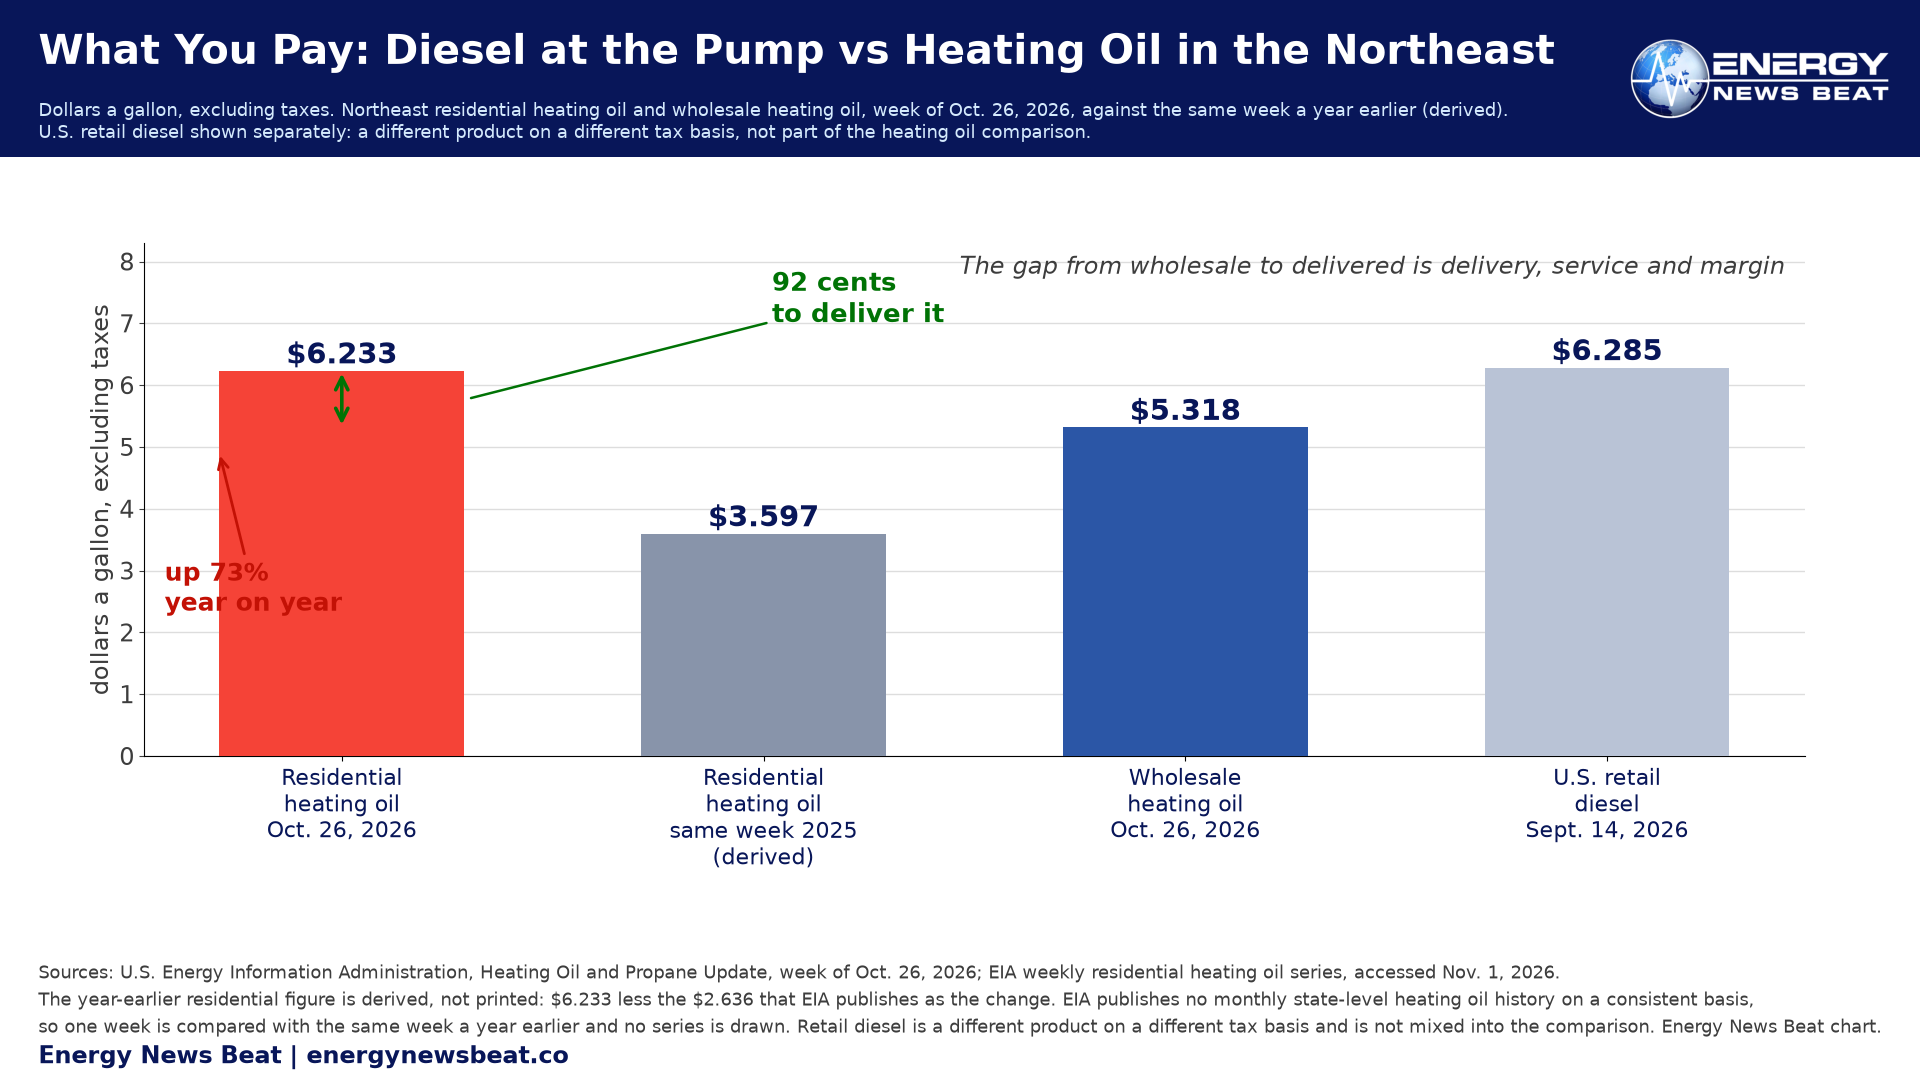
Home heating tells it more harshly, and it is the smallest share of households facing the steepest increase. About 3 percent of American homes heat with oil, almost all in the Northeast. EIA’s weekly survey put residential heating oil at $6.233 a gallon nationally in the week of Oct. 26, excluding taxes, up $2.636 from a year earlier. That is 73 percent on printed dollars. New England paid $6.165; East Coast states ran from $6.040 in Maine to $6.441 in New York. Wholesale heating oil was $5.318, up $2.750. EIA puts the household bill up 21 percent to $2,115 on 402 gallons at $5.26 — a price rise of more than 30 percent, partly offset by a milder winter in the Northeast. The relief is weather, not supply.
The region’s problem is structural, and EIA says so. East Coast distillate inventories were 32 percent below their five-year seasonal average in September, and EIA expects them between 20 and 30 percent below through this winter. New York Harbor heating oil spot was $4.910 a gallon on Sept. 11, up $2.714 on the year. The region consumes more distillate than it makes: in 2025 it imported 124,000 barrels a day, about 10 percent of regional consumption, mostly from Canada. EIA’s own assessment of that lifeline is that importers “will face difficulty boosting imports enough to bring inventory levels closer to normal during the winter heating season.”
Two things make the relief smaller than the headline. The retail margin eats part of it: EIA says decreases in wholesale crack spreads will not immediately translate into lower retail prices, because that gap carries taxes, distribution and dealer margin, and those margins, depressed by surging wholesale prices, are expected to rise back above the five-year average in 2027. Then the floor: EIA expects distillate stocks to stay below the 2021-2025 average throughout the forecast, keeping diesel cracks elevated and retail prices above $4 through 2027. Above $4 is not a return to normal. It is the new floor.
The step from wholesale to delivered is real money: $6.233 against $5.318 leaves about 92 cents a gallon for delivery, service and margin. The wholesale number is not the bill.
Here is what would have to happen, and by when. Freight has to keep normalising: Gulf Coast to Ningbo at $35 a barrel against $5.80 a year earlier is the largest single distortion in the system. Middle East product supply has to recover, the condition the IEA names and does not promise. China’s exports have to approach the 6 million tonnes a month Sparta says the quota implies. If they happen, the 2027-28 heating season is cheaper than this one; if not, EIA’s floor of above $4 holds. This winter is already set by cracks that have printed.
For investors the signal is in the margin, not the barrel. A refiner with distillate yield and a Gulf Coast slate is earning a margin unthinkable in January, when the same crack was $25.32, while a refiner in Singapore paying record freight earns a fraction of it. Same industry, opposite outcomes. The difference is location and configuration, not skill.
The caveats, and the case against
The strongest objection is that this mistakes a freight shock for a structural one. The American cracks are EIA spot subtractions against WTI Cushing, not Platts assessments, a Platts crack uses different legs and will not print $96.84. The “96 percent of sessions” figure comes from a vendor whose session count does not reconcile with EIA’s, so it is attributed rather than asserted.
The third is that some facts here rest on single sources: the ESPO numbers are trader-reported offers and one heard deal, not exchange settlements. And the ten China origins the wire table carried account for 87 percent of September imports; Canada, published as a rate but not a tonnage, takes the named total to 90.7 percent, and 836 thousand barrels a day, 9.3 percent, sits across nine further origins that the published table did not break out. It is left undivided here. The fourth matters most: Europe has announced a rethink and America has signed a determination, but neither has restarted a closed refinery or funded a new one. Intent is not capacity. Until a plant runs, the trap stays open.
| STU’S TAKE
Opinion. Every number is linked to its source. Crude is not the problem, and that is the whole point. The world has 103.3 million barrels a day of distillation capacity sitting at 80.8 percent utilisation, 5.3 million barrels a day of new capacity coming against three hundred thousand of closures, and thirteen unsold West African cargoes floating around the Atlantic at the steepest discounts in fifteen years. If this were a crude problem, prices would have solved it by now. It is not a crude problem. What is short is diesel out of the Atlantic basin, and the refineries that could make it are not where the barrels are or not configured to run them. OPEC’s own numbers put the entire global addition to middle distillate output in 2026 at four hundred thousand barrels a day. That is the shortage, and it explains why a Gulf Coast refiner was earning $96.84 a barrel on diesel on Oct. 27 while a Singapore refiner was earning $54 on Oct. 30. Three days apart. Different basin. That gap is the story. I have argued that blue states follow Europe, and Europe is now worth watching. On Oct. 28 Brussels launched a high-level dialogue on refining and the Energy Commissioner said on the record that the goal is to increase output from European refining assets to bring fuel prices down. Six member states — including Poland, Italy and Czechia — wrote to the Council saying crude security and product security are different things, and that crude cannot substitute for diesel without the processing capacity. That is the argument I have been making, in a government document. But I have to be straight with you about the limit of it. No European refinery that actually closed has reopened this year. Every restart headline is maintenance at a plant that never stopped. The closest real case is ISAB in Sicily, where the new owner has a €1.3 billion plan that names decommissioned units — and no date. Europe has changed direction. It has not changed facts. And here is the awkward part for my own argument: the President signed a determination on Oct. 22 doing at the federal level exactly what I want states to do. If the case is good, it is good whether Washington got there first or not. On Iraq I have to be honest too. I have argued the money is controlled through the Fed and the Treasury, and that part holds up: in April Treasury blocked nearly half a billion dollars of Iraqi oil revenue in banknotes, and cash deliveries resumed in June only after Baghdad agreed to new controls. I predicted that the IRGC would not be held in check until there are Venezuelan Style controls placed on Iran. We do not have to hold Kharg Island to do that with the US Navy intercepting ships at will, and the US Treasury tracking shipments. The IRGC does not care about the great Iranian people and seem like they are willing to go down with the ship. Iraq is a cat of a totally different color as we are pulling our military out, and are maintaining monetary controls and approvals on oil and gas projects. They are still selling oil and have an undocumented heavy influence of Iranian people running around or moving oil when possible. It is unconfirmed and we will not publish things until we have proof and not an article or X post. It is also worth noting that I had said that the Russian/Ukraine war would not end until Russia had permanent control of the land bridge through to Crimea. It seems that this one is looking to pan out as we pray for peace. That is for a longer discussion. Will prices come down? The curve says yes and says next year, not this quarter. Twenty-nine dollars of backwardation from December to December is a market expectation, and it rests on Middle East product supply coming back — which the IEA says is the condition, and which nobody can promise. At the pump, diesel averages $6.29 and EIA’s annual average falls from $5.19 this year to $4.49 next. Relief, not rescue. What I would watch is the crack, not the barrel. As long as the Atlantic diesel crack stays near a hundred dollars, the shortage is real regardless of what crude does. When that number falls because the product has come back, the trap has sprung.
|
Appendix
Sources, verbatim excerpts, full data tables, methodology notes and corrections for “The Atlantic Distillate Trap”. Every figure in the article resolves to an entry below. Where a number is an Energy News Beat calculation it is labelled as one here and in the text. Access dates are Nov. 1, 2026 unless a document carries its own date.
A. Sources, with links and access dates
All accessed Nov. 1, 2026. Descriptions are plain text; the link is the source key.
U.S. Energy Information Administration, daily spot price, Gulf Coast No. 2 Ultra Low Sulfur Diesel, series EER_EPD2DXL0_PF4_RGC_DPG. Oct. 27, 2026 assessment $4.767/gal. Link
U.S. Energy Information Administration, daily spot price, WTI Cushing, series RWTC. Oct. 27, 2026 assessment $103.37/bbl. Link
U.S. Energy Information Administration, daily spot price, Europe Brent FOB, series RBRTE. Oct. 27, 2026 assessment $123.10/bbl. Link
U.S. Energy Information Administration, Weekly Petroleum Status Report, week ending Oct. 23, 2026. Distillate fuel oil ending stocks 102.8 million barrels. The five-year comparison from this series is Energy News Beat arithmetic. Link
U.S. Energy Information Administration, weekly U.S. ending stocks of distillate fuel oil, series WDISTUS1. Five-year same-week mean computed by Energy News Beat across 2021-2025. Link
U.S. Energy Information Administration, weekly East Coast (PADD 1) ending stocks of distillate fuel oil, series WDISTP11. Link
U.S. Energy Information Administration, weekly U.S. refinery utilisation of operable capacity, series WPULEUS3, all years 1990-2026. Link
U.S. Energy Information Administration, Today in Energy, U.S. refineries have been running at very high rates in 2026, Oct. 22, 2026. The source of both the above-95-percent May-to-September claim and the 4 percent capacity decline. Link
U.S. Energy Information Administration, Short-Term Energy Outlook, October 2026, Table 2 Energy Prices, released Oct. 6, 2026. Link
U.S. Energy Information Administration, Short-Term Energy Outlook, October 2026, petroleum products section. Source of the East Coast 32 percent figure, which is a September measurement for PADD 1. Link
U.S. Energy Information Administration, Short-Term Energy Outlook, October 2026, global oil section. Link
OPEC, World Oil Outlook 2026, 20th edition, launched June 18, 2026, Chapter 5 Refining outlook. Crude distillation capacity 103.3 mb/d as of January 2026; 2025 utilisation 80.8 percent; additions 5.3 mb/d 2026-2030; closures 0.3 mb/d; potential incremental product output 1.0 mb/d in 2026 of which middle distillates 0.4 mb/d, modelled at an assumed 90 percent utilisation. Link
International Energy Agency, Oil Market Report, October 2026, published Oct. 14, 2026. Highlights and the gasoil/diesel section. Link
Egypt Oil and Gas, reporting IEA freight detail from the October 2026 Oil Market Report, Oct. 15, 2026. Link
Valero Energy Corporation, third-quarter 2026 earnings call transcript, Oct. 22, 2026, via The Motley Fool. The freight figures were given by Randy Hawkins. Link
CME Group, Daily Bulletin, Energy Futures Products, session of Friday Oct. 30, 2026. Settlements for every Brent contract month used in this article. Link
ICE Futures Europe, Brent Crude Futures contract specification and expiry calendar. Confirms the December 2026 contract expired Oct. 30, 2026. Link
ICE Brent crude futures contract table for the Oct. 30, 2026 session, second independent rendering used to confirm every settlement. Link
CommodityScope, ICE Brent settlements, third independent rendering used to confirm the Oct. 30, 2026 curve. Link
Reuters, oil settlement report for Friday Oct. 30, 2026, carried by Euronext. Brent December settled up $2.76 at $117.64 before expiring. Link
Reuters, Asia gasoil market report, Oct. 30, 2026. Singapore 10ppm gasoil crack slightly more than $54 a barrel, at more than three-month lows. Link
Clyde Russell, Reuters column, carried by OE Digital and Bitumen Magazine, Aug. 24, 2026. Gives the Singapore gasoil crack record of $85.63 on March 30, 2026, and the pre-war level of $21.90 on Feb. 27, 2026. Link
Bitumen Magazine, carrying the Clyde Russell column on Asian gasoil cracks, August 2026. Link
Reuters, US diesel crack surpasses $100 a barrel for the first time, Aug. 17, 2026. This is the source of the $102.20 peak figure, which belongs to the US diesel crack against WTI, not to Singapore. Link
The Vault Report, crack spread data. Source of the 96 percent of sessions since 1986 statement, a vendor percentile attributed by name in the text. The vendor session count does not reconcile with EIA observation counts, so the percentile is attributed and the count is not printed. Link
Reuters, Saudi Arabia unexpectedly cuts November oil prices to Asia, Oct. 4, 2026. Arab Light to Asia $5.00 under Oman/Dubai, down $3.00, widest since June 2020. Link
Kpler, West African differentials drop with high freight and growing competition, Oct. 9, 2026. Roughly 13 unsold October-loading Angolan and Nigerian cargoes. Link
Nairametrics, reporting Bloomberg and Platts data, Oct. 8, 2026. Hungo traded at $19.60 under Dated Brent on Oct. 6, 2026, the widest for a West African grade in Platts data since 2011. Link
Vortexa, Is an Atlantic Basin crude glut on the way, published Oct. 26, 2026. Laden VLCC count 415 on Oct. 15-16; Gulf Coast to Ningbo VLCC freight averaging $35 a barrel in October against $5.80 a year earlier. Link
Financial Markets, reporting Platts Dated Brent assessments, Oct. 15, 2026. Dated Brent $125.975 against Brent futures $105.92, a premium of about 19 percent. Link
Seoul Economic Daily, reporting Nikkei Asia, Oct. 13, 2026. Dated Brent topped $154 on Oct. 5, the highest since LSEG began compiling the data in 1991, and the gap to futures widened beyond $50, the largest on record. Link
General Administration of Customs of the People’s Republic of China, monthly release, Oct. 15, 2026. September 2026 crude petroleum oils imports 37.096 million tonnes, value USD 24,608.9 million. Link
Business Recorder, reporting Reuters, October 2026. China September crude imports 9.03 million barrels a day, up 1.1 percent on the month. Link
Blooming Global, China crude import and export report for September 2026, Oct. 22, 2026. HS 27090000 detail, 37,095,537,406 kg and USD 24,608,921,729, down 20.9 percent year on year. Customs-derived origin tonnages used for Russia, Brazil, Iraq, Saudi Arabia, Indonesia, Oman and Malaysia. Link
South China Morning Post, Oct. 22, 2026. Chinese customs data on Middle East crude imports, 13.8 million tonnes in September, up 25.7 percent month on month. Used to reconcile the origin table. Link
Iraqi News, reporting Chinese customs data, Oct. 20, 2026. Iraq supplied China 1.18 million barrels a day in September. Link
Clyde Russell, Reuters column on China crude imports, Oct. 22, 2026, carried by The Star. Kpler seaborne estimate of 9.02 million barrels a day for October, and the above-10-million total including pipeline crude. Link
Kpler, Chinese refiners step up Middle East crude buying amid record stock drawdowns, Oct. 14, 2026. Pipeline imports from Russia and Kazakhstan around 800,000 barrels a day. Link
Vortexa, Gulf producers stand to gain as China replaces Iranian loss, by Emma Li, Oct. 20, 2026. October seaborne imports expected around 8.8 million barrels a day; Saudi arrivals above 2 million with about 75 percent to Sinopec and PetroChina; Iraqi arrivals around 1.1 million. Link
Kpler, Iran oil on water outside the blockade zone hits zero as Tehran trilemma sharpens, by Homayoun Falakshahi, Oct. 22, 2026. No crude or condensate loaded since Aug. 25; oil on water at zero in mid-October from 88.8 million barrels on July 14; revenue expected to reach zero by mid-December. Link
Iran International, by Dalga Khatinoglu, Oct. 23, 2026. China imported 276,000 barrels a day of oil recorded as Malaysian in September, down from nearly 1.3 million in 2025. Link
CENTCOM statement of Oct. 22, 2026, marking 100 days of the naval blockade, carried by Iran International. The blockade helped prevent Iran exporting at least $25 billion of crude. Link
TradeWinds, Oct. 2026, reporting the CENTCOM statement on $25 billion of prevented exports. Link
Times of Israel, Oct. 16, 2026. Adm. Brad Cooper video statement giving the same $25 billion figure six days before the CENTCOM post. Link
Reuters, Russian ESPO oil sellers seek record premiums as Gulf exports uncertain, Oct. 23, 2026. November and December cargoes offered at $26 to $27 over ICE Brent; one deal by a large independent Chinese refiner heard at $23 to $26; two offers for later cargoes above $30. Link
Reuters, carried by Baird Maritime, Sept. 2, 2026. ESPO premiums of more than $7 a barrel over ICE Brent, with offers up to a record $10. Link
Reuters, China independent refiners scramble for oil underpinning spot premiums, Sept. 10, 2026. ESPO at $12 above Brent for November delivery; Sinopec and Yulong taking most ESPO cargoes from Kozmino. Link
S and P Global Commodity Insights, APPEC coverage, Sept. 10, 2026. ESPO premiums crossing $20 a barrel as Chinese buyers compete for Russian barrels. Link
Reuters, China newest refiner Yulong starts up crude unit, Sept. 20, 2024. The 400,000 barrel a day crude unit. Link
Reuters, China refiner Yulong boosts Russian oil imports after sanctions, Oct. 28, 2025. Fifteen Russian cargoes in November, 370,000 to 405,000 barrels a day against a usual 200,000. Link
Reuters, How sanctions made a showpiece Chinese refinery Western partners run for the exits, Nov. 26, 2025. Yulong was not built to run Russian crude; sanctions removed its alternatives. Link
Offshore Technology, Yulong refinery data. Crude-to-chemicals complex, chemicals yield above 50 percent, Nelson complexity about 8.13. Link
European Commission, Commission launches High-Level Dialogue with the European oil refining sector, Oct. 28, 2026. Co-chaired by Dan Jorgensen and Andrius Kubilius; NATO among participants; the 70 percent jet and 85 percent diesel figures. Link
Council of the European Union, document 14726/1/26 REV 1, Brussels, Oct. 28, 2026. Non-paper from Bulgaria, Czech Republic, Hungary, Italy, Poland and Slovakia for the Energy Council of Oct. 29, 2026. Link
Council of the European Union, Transport, Telecommunications and Energy Council, Oct. 29, 2026, meeting page. Link
Anadolu Agency, Oct. 28, 2026, carrying a shorter press-conference variant of the Jorgensen remarks. The Commission text is used as canonical. Link
BP, bp completes sale of Gelsenkirchen refinery to Klesch Group, Aug. 3, 2026. Agreement announced March 19, 2026, completion Aug. 3, 2026; 265,000 barrels a day crude capacity across the Horst and Scholven sites, about 12 million tonnes a year. Link
Ludoil, Ludoil assumes leadership of ISAB, Sept. 23, 2026. Includes the Italian wording on recommissioning decommissioned primary distillation and HDS units, and the 1.3 billion euro five-year investment. Link
ISAB S.r.l., refinery page. 320,000 barrels a day, about a fifth of Italian refining capacity, at Priolo Gargallo in the province of Siracusa. Link
MOL Group, The AV3 unit at the Danube refinery has resumed operations at full capacity, Oct. 30, 2026. States expressly that the restoration involved no capacity expansion. Link
Neste, Porvoo refinery maintenance turnaround, 2026. A nine-week planned turnaround, not a closure. Link
ORLEN Unipetrol, Kralupy refinery press release, May 12, 2026. Planned maintenance shutdown and restart. Link
Hydrocarbon Processing, Shell restarts crude unit at Pernis oil refinery, April 2026. Recovery from a brief unplanned outage. Link
La Verdad, Repsol Cartagena topping unit repair, April 9, 2026. Fire damage in January 2026; site operating throughout. Link
Reuters, Crude processing ends at Scotland Grangemouth oil refinery, April 29, 2025. No restart announced. Link
The Chemical Engineer, Phillips 66 to buy idle UK refinery site but will not restart operations. Link
heise online, German refinery strategy, Oct. 2026, reporting the Economy Ministry Raffineriestrategie of Oct. 23, 2026. Intent, with no site spared or reopened as a result. Link
Federal Register, Presidential Determination 2027-01, signed Oct. 22, 2026 and published Oct. 28, 2026 at 91 FR 68011, FR Doc 2026-22052. Designates domestic petroleum production, refining and logistics capacity under section 303 of the Defense Production Act of 1950, as amended. Link
Federal Register, Presidential Determination 2026-11, signed April 20, 2026 and published April 23, 2026 at 91 FR 21933, FR Doc 2026-08016. Listed separately because the Energy Department’s own release cross-references this number while describing the October action, and the two are routinely confused. Link
U.S. Department of Energy, Energy Department to use Defense Production Act funding to restart American refinery and expand, Oct. 22, 2026. Up to $150 million in DPA Title III funding, selection ongoing. Link
CBS News, Face the Nation with Margaret Brennan, transcript of the interview with Energy Secretary Chris Wright, Sept. 6, 2026. Link
Reuters, How the U.S. controls Iraq oil revenues, Jan. 23, 2026. Iraqi oil revenue held in Central Bank of Iraq accounts at the Federal Reserve Bank of New York. Link
Reuters, US threatens to starve Iraq of its oil dollars over Iranian influence, Jan. 23, 2026. Link
Al Jazeera, reporting the Wall Street Journal, April 22, 2026. Treasury blocked a cargo plane carrying nearly $500 million in US banknotes from Iraqi oil revenues; the Fed cancelled at least two cash shipments at Treasury instruction. Link
Wall Street Journal, carried by Tovima, July 8, 2026. Banknote deliveries halted in late February and resumed in late June after Baghdad agreed to new controls on dollar flows. Link
Executive Order 13303, Protecting the Development Fund for Iraq and Certain Other Property in Which Iraq Has an Interest, May 22, 2003, 68 FR 31931. The section 1 attachment prohibitions were terminated in relevant part by E.O. 13668 in 2014. Link
U.S. Department of the Treasury, press release SB0492, Economic Fury targets Iraqi oil official and Iran-backed terrorist militias in Iraq, May 7, 2026. Ali Maarij Al-Bahadly, Deputy Minister of Oil, designated under E.O. 13902. Link
OFAC, Recent Actions, May 7, 2026. The formal designation record. Link
U.S. Department of State, Sanctioning Iran-aligned actors undermining Iraq sovereignty and exploiting its resources, May 2026. Link
Reuters, US sanctions Iraq deputy oil minister and militias over Iran support, May 7, 2026. Link
Zawya, Iraq SOMO offers deeper discounts for October-loading crude, document shows, 2026. Basrah Medium $34.50 and Basrah Heavy $37 under destination benchmarks. Link
Hydrocarbon Processing, reporting Reuters, Oct. 6, 2026. Chinese independents bought at least 12 million barrels of Iraqi and Qatari crude at $12 to $20 a barrel over ICE Brent on a delivered basis. Link
Kommersant, Russian crude ESPO premium to China falls $10 to $20 a barrel, Oct. 26, 2026. Cites S&P Global data; Vortexa Middle East ex-Iran shipments to China 4.5 million barrels a day in October against a 2025 average of 4.7; Argus assessment of ESPO in Shandong at $122.34 a barrel on Oct. 16. Includes NEFT Research commentary. Link
Reuters, China issues nearly 4 million tons of fuel export quotas in fourth batch for 2026, sources say, Oct. 28, 2026, via MarketScreener. Fourth batch of about 3.7 million tonnes, total for 2026 roughly 40 million tonnes. Link
Reuters, Asian gasoline margin plummets to over six-month lows, Oct. 30, 2026, via MarketScreener. Gasoline margin about $11 a barrel over Brent against a record $50.53 on Oct. 1; states the 2026 clean product export allowance is 6 percent higher than last year. Link
Reuters, Singapore oil product inventories edge up as clean distillate volumes trek higher, Oct. 29, 2026. Light distillates 11.304 million barrels in the week to Oct. 28; gasoline imports 314,000 tonnes; middle distillates about 8.5 million barrels; total onshore stocks 38.49 million barrels. Link
Sparta Commodities, June Goh, Confusing signals from China, Oct. 30, 2026. Implied November and December exports of roughly 6 million tonnes a month to use the full quota against about 3.8 in October. Link
S&P Global Platts assessments of the second-month Singapore gasoil swap crack against Dubai swaps, reported by IndexBox, Oct. 22, 2026. Record $83.02 on Sept. 16; September average $72.97; August average $64.71; 2025 average $18.16; Oct. 20 assessment $66.91. Link
Hellenic Shipping News, reporting Platts, China yet to restrict refined oil product export despite tight domestic supply, Sept. 10, 2026. Platts assessed the second-month Singapore gasoil swap crack at $71.61 on Aug. 19, a record at the time, superseded on Sept. 16. Link
General Index, September Pricing Analysis, Asia Middle Distillates, Oct. 5, 2026. Gasoil M1 crack to Dubai averaged $74.35 a barrel in September against $67.43 in August. A different tenor from the Platts second-month swap. Link
U.S. Energy Information Administration, Heating Oil and Propane Update, week of Oct. 26, 2026, accessed Nov. 1, 2026. Residential heating oil $6.233 a gallon excluding taxes, up $2.636 from a year earlier; wholesale $5.318, up $2.750; New England $6.165; East Coast range $6.040 Maine to $6.441 New York. Link
U.S. Energy Information Administration, weekly U.S. residential heating oil prices, series EPD2F_PRS_DPGAL_W, for the time series behind the weekly update. Link
U.S. Energy Information Administration, Winter Fuels Outlook 2026-27, published Oct. 6, 2026. Heating oil expenditure up 21 percent to $2,115; 402 gallons at $5.26 a gallon; distillate production down because of reduced global refining activity. Link
G7 Leaders Statement on global energy security and market stability, Oct. 2, 2026, published by the UK Foreign, Commonwealth and Development Office and by the European Commission. Coordinated release through the IEA of 100 million barrels beginning immediately over four months, including a frontloaded substantial diesel release within the first 20 days. Link
Euronews, Exclusive: G7 100-million-barrel pledge tied to unfinished March emergency oil release, Oct. 8, 2026. Internal document: of 400 million barrels pledged in March, 326 million released; the 100 million can be covered within the existing action. Link
U.S. Department of Energy, Energy Department Awards Contracts from the Strategic Petroleum Reserve as Part of President Trump Emergency Exchange, Oct. 29, 2026. More than 40 million barrels awarded, completing the U.S. commitment of 172 million barrels within a 400 million barrel IEA action. Link
U.S. Energy Information Administration, Outlook on global refining to 2028. Describes Yulong as likely adding about 100,000 barrels a day of transportation fuels, with the rest geared to naphtha and petrochemical feedstocks, and notes a hydrocracker that can shift to diesel. Link
Executive Order 13668, Ending Immunities Granted to the Development Fund for Iraq and Certain Other Iraqi Property and Interests in Property Pursuant to Executive Order 13303, as Amended, May 27, 2014, 79 FR 31019. Terminates the section 1 prohibitions of E.O. 13303 and names the Central Bank of Iraq accounts expressly. States that it is not intended otherwise to affect the national emergency, and not intended to affect immunities enjoyed by the Government of Iraq and its property under otherwise applicable law. Link
Industrial Info Resources, BP Delays Unit Closure at Main Germany Refinery. BP delayed the planned permanent closure of a 70,000 barrel a day crude distillation unit and a 40,000 barrel a day vacuum distillation unit at its largest German refinery, the second time closure plans were reversed while the company looked for a buyer, after a July decision to keep the units running on a tight European diesel market. Link
Bloomberg, BP Plans to Keep Crude Unit at German Refinery Running for Now, July 8, 2025. BP kept a crude-processing unit it had planned to close at Gelsenkirchen running because the market contributed to the plant’s profitability. Link
U.S. Energy Information Administration, Weekly Petroleum Status Report, data for the week ending Sept. 11, 2026, released Sept. 16, 2026, highlights. Distillate inventories increased 1.6 million barrels, 13 percent below the five-year average. National average retail diesel $6.285 a gallon on Sept. 14, 2026. Link
U.S. Department of the Treasury, Office of Foreign Assets Control, Iraq Stabilization and Insurgency Sanctions Regulations, final rule, 82 FR 61450, FR Doc. 2017-28023, published Dec. 28, 2017, 31 CFR Part 576. Amends the Regulations to implement E.O. 13668 by removing the regulatory provisions that implemented the protections granted under amended E.O. 13303. Instruction 2 reads: Remove Sec. 576.206 from subpart B. Section 576.206 had been titled Protection granted to the Development Fund for Iraq, Iraqi Petroleum and Petroleum Products, and the Central Bank of Iraq. Also removes 576.308, 576.508 and 576.404(c). Signed by John E. Smith, Dec. 22, 2017. Part 576 remains a program covering cultural property and blocked persons. Link
Interfax, China crude oil imports by country, September 2026, published Oct. 20, 2026. Carries the full origin table from China General Administration of Customs in tonnes, with a barrels-a-day rate per origin and a nine-month cumulative table: Russia 2,419 kb/d, Brazil 1,252, Iraq 1,177, UAE 730, Saudi Arabia 657, Indonesia 419, Kuwait 394, Oman 298, Malaysia 282, Angola 227, Canada 336, total 9,027. Totals 37.096 million tonnes for the month; Brazil 44.29 million tonnes and Saudi Arabia 43.12 over nine months. Link
U.S. Energy Information Administration, Weekly Petroleum Status Report, week ending Sept. 11, 2026, released Sept. 16, 2026. New York Harbor No. 2 heating oil spot $4.910 a gallon on Sept. 11, up $2.714 from a year earlier. Distillate stocks 107.9 million barrels, 13 percent below the five-year average. Crude runs 17.3 million barrels a day at 96.8 percent utilisation; distillate production 5.2 million barrels a day; distillate imports 114,000 barrels a day; four-week distillate supplied 3.6 million barrels a day, down 3.3 percent; retail diesel $6.285 a gallon on Sept. 14, up $0.318 on the year and $2.546 above a year earlier. Link
Executive Order 13364, Modifying the Protection Granted to the Development Fund for Iraq and Certain Property in Which Iraq Has an Interest, Nov. 29, 2004, 69 FR 70177, published Dec. 2, 2004. Rewrote section 1 of E.O. 13303 and named the Central Bank of Iraq accounts expressly among the property against which attachment is prohibited. Link
Continuation of the National Emergency with Respect to the Stabilization of Iraq, 91 FR 25071, published May 7, 2026. Continues the national emergency declared in E.O. 13303 for a further year and cites E.O. 13668 among the orders on which it relies, which is the point: the continuation keeps the emergency alive while the attachment shield itself has been terminated. Link
B. Key excerpts from primary documents
Quoted verbatim, with enough surrounding text that a reader can see what was cut. Where a quotation is commonly truncated, the tail is included and noted.
IEA, Oil Market Report, October 2026, Highlights, third bullet, published Oct. 14, 2026. The best argument against this article, quoted in full: “Record freight and crude costs crushed margins in Europe and Asia, while discounted feedstocks propelled US margins to new highs.” Link
IEA, same report, gasoil and diesel section. Quoted in full because the final clause is the agency’s own condition and is routinely cut: “Higher global refinery output will return the gasoil/diesel market to a surplus in 1Q27, lifting stocks broadly in line with normal seasonal patterns. However, this will be insufficient to offset the deficit accumulated during 2026. As a result, the gasoil market balance will remain tight well into 2027 and is dependent on a recovery of product supply from the Middle East. Failing this, further demand reductions and the heavy economic costs these will entail may be needed to balance markets.” Link
Randy Hawkins, Valero third-quarter 2026 earnings call, Oct. 22, 2026, in Q and A. Note the speaker: this is not the chief operating officer, Gary Simmons, who spoke elsewhere on the same call: “the cost to move a VLCC from the Gulf Coast to Asia is now averaging around 30 to $35 per barrel. That compares with the 2025 average of around $5 a barrel.” Link
Vortexa, Oct. 26, 2026, on the week of Oct. 15-16: “Laden VLCC count reached 415 on 15-16 October. The last time the count was that high was November, resulting in a record crude-on-water build.” Link
Vortexa, same note, on the freight that makes the IEA argument: US Gulf to Ningbo VLCC freight “averaged $35/bl in October (days 1-25), up six-fold y-o-y ($5.80/bl in Oct 2025 days 1-25).” Link
Reuters, Oct. 23, 2026, on ESPO. Note the difference between an offer and a deal, which this article keeps: “November and December cargoes were offered at premiums of $26-$27 a barrel, with a few remaining unsold, another trader said.” And: “one recent deal by a large independent Chinese refiner for November and December cargoes was heard at premiums of $23-$26 a barrel to ICE Brent, a senior Chinese trader said, adding that smaller plants would lose money at those levels.” Link
Reuters, Oct. 23, 2026, on why the Brent leg matters: Russian crude is priced against Brent while Middle East grades are priced against Dubai, and Brent settled $5.05 above Dubai that Thursday. Part of the apparent size of the dollar denominator premium is that spread. Link
Kpler, Homayoun Falakshahi, Oct. 22, 2026, on the blockade and the revenue timing. The wording is an expectation, not a fact, and is quoted with the qualifier: “Iran has not loaded a crude or condensate cargo since 25 August, and tankers that loaded since mid-July have not been able to pass through the blockade line.” And: “The financial hit is yet to come. Chinese buyers typically pay one to two months after discharge, so we expect Iran crude and condensate revenues to reach zero by mid-December, for the first time in its history.” Link
Kpler, same note, on the oil-on-water figure, which is an analyst assessment rather than a platform reading, as Kpler itself notes: “Iranian oil on water outside the blockade zone fell to zero in mid-October, from a peak of 88.8 Mbbl on 14 July. Around 43 Mbbl remain stranded inside the blockade area.” Link
CENTCOM, statement of Oct. 22, 2026 marking 100 days: “Today marks 100 days since CENTCOM forces resumed America’s steel wall naval blockade against Iran. This effort has helped prevent Iran from exporting at least $25 billion worth of crude oil and constrained the IRGC’s ability to fund proxy militias, criminal networks, and terrorism.” An admiral made the same claim in a video statement on Oct. 16. Link
Dan Jorgensen, European Commissioner for Energy and Housing, Oct. 28, 2026, Brussels. The sentence continues past the point where it is usually cut, and the commission surrounding text is heavily conditioned on decarbonisation: “Today’s dialogue has been very fruitful, but it has been a first step. We will work to increase outputs from refining assets in Europe, because ultimately, we need to bring fuel prices down. But the work does not stop in the here and now of the crisis.” Link
European Commission, background note, Oct. 28, 2026. The source of the two supply shares: “Oil refining is a strategic asset for Europe energy security, industrial competitiveness and defence readiness. EU refineries supply about 70% of jet fuel and 85% of diesel consumed in Europe. More than 90% of transport depend on oil, globally.” Link
Council of the European Union, 14726/1/26 REV 1, Oct. 28, 2026, non-paper from six member states. The sentence that states the thesis of this article in a government document: “Security of crude oil supply and security of refined product supply are distinct challenges. Crude oil cannot substitute for diesel or aviation fuel without suitable processing capacity. Moreover, the crisis in the Middle East has unveiled our dependence on imports of refining by-products, such as sulphur and helium.” Link
MOL Group, Oct. 30, 2026, on the AV3 unit at the Danube refinery, which is the cleanest test of whether a restart added capacity. It did not: “The restoration did not involve any capacity expansion; the AV3 unit has resumed production with its original technological capacity.” Link
Ludoil, Sept. 23, 2026, on ISAB at Priolo Gargallo, in the original Italian. Dismesse means decommissioned, so this is an announced intent to bring back genuinely shut units, with no date attached: “la rimessa in servizio e l ammodernamento di alcune unita di processo dismesse, tra cui: la distillazione primaria e la desolforazione (HDS) nel sito Nord, il solvent deasphalting (SDA) nel sito IGCC-Sud, il thermal cracking anch esso nel sito Sud.” Link
Chris Wright, Energy Secretary, Face the Nation, CBS, Sept. 6, 2026. The word global is part of the quotation and is usually dropped: “So its global refining capacity is why gasoline and diesel prices are high, even more than oil prices.” Link
U.S. Treasury, SB0492, May 7, 2026, on the Iraqi official. The authority is the Iran petroleum authority, E.O. 13902, not any Iraq-specific controls regime: “This action includes Ali Maarij Al-Bahadly, Iraq Deputy Minister of Oil, who abuses his position to facilitate the diversion of oil to be sold for the benefit of the Iranian regime and its proxy militias in Iraq.” Link
U.S. Treasury, same release: “Maarij authorized trucking several million dollars worth of oil per day from the Qayarah oil field to VS Oil in Khor Zubayr for export. VS Oil oversaw the mixing of Iranian oil with Iraqi oil before being shipped to market. Maarij is also responsible for falsifying documentation on the provenance of oil for Said network, enabling it to be smuggled to market disguised as purely Iraqi oil.” Link
Al Jazeera reporting the Wall Street Journal, April 22, 2026, on the lever Stu describes, which is real: a cargo plane carrying nearly $500 million in US banknotes from Iraqi oil revenues was blocked by the US Treasury, and the Fed cancelled at least two cash shipments at Treasury instruction. Link
Federal Register, Presidential Determination 2027-01, 91 FR 68011. The statutory phrase is broader than refining alone and is quoted rather than paraphrased: “domestic petroleum production, refining, and logistics capacity, including exploration and production, gathering and transmission pipelines, storage, and marine terminals” designated as “industrial resources, materials, or critical technology items essential to the national defense.” Link
U.S. Department of Energy, Oct. 22, 2026, on the money. Note up to, and note that nothing has been awarded: “President Donald J. Trump today announced plans to provide up to $150 million in Defense Production Act (DPA) Title III funding to expand domestic petroleum production, storage, and logistics at refineries across the United States.” Link
China customs, October 2026 release, the September figure in tonnes, which is the published number and from which every barrel figure in this article is derived: crude petroleum oils imports 3,709.6 wan tonnes, or 37.096 million tonnes, value USD 24,608.9 million, dated 2026/10/15. Link
China customs HS 27090000 detail for September 2026, the most granular primary available, and the reason the year-on-year decline in this article is stated as roughly 21 percent: imports 37,095,537,406 kg, value USD 24,608,921,729, volume down 2.20 percent month on month and 20.90 percent year on year. Link
Vortexa, Emma Li, Oct. 20, 2026, the basis for both the 8.8 million figure and the Saudi and Iraqi October expectations: “China total seaborne crude imports are expected to strengthen to around 8.8mbd in October, up from a Q3 average of 7.5mbd, although still well below the 2025 average of 10.6mbd.” And: “Saudi arrivals, all originating West of Hormuz, are expected to exceed 2mbd in October, compared with a 2025 average of 1.6mbd. Around 75% of these volumes are expected to be absorbed by China’s two largest oil majors, Sinopec and PetroChina.” And: “Iraqi arrivals are expected to remain around 1.1mbd, serving a broader range of buyers that includes Shandong teapot refiners.” Link
Hydrocarbon Processing reporting Reuters, Oct. 6, 2026, on the discount that is really a premium, which is the correction this article makes to the common framing: Chinese independents bought at least 12 million barrels of Iraqi and Qatari crude for October and November at premiums of $12 to $20 a barrel to ICE Brent on a delivered basis, at a time when the FOB official selling prices were discounted by $34.50 and $37 against destination benchmarks. Link
Reuters, Sept. 10, 2026, the clearest statement of what Yulong is and is not in this story. It is one of two large ESPO takers, not the sole cause of the premium: Sinopec and Yulong were taking most ESPO cargoes from Kozmino, leaving the independent teapots to seek alternatives, which pushed ESPO to $12 above Brent for November delivery. Link
Reuters, Nov. 26, 2025, on why Yulong runs Russian crude. It was not designed for it: the complex was built to run imported light and sweet crude and became Russian-dependent because sanctions removed its alternatives and its Western partners exited. Link
Reuters, Oct. 30, 2026, on the product repricing that followed the Chinese quota: “Asian gasoline margins more than halved … shrank to about $11 per barrel over Brent crude, the lowest level since March, from a record peak of $50.53 on October 1.” The same dispatch describes the fourth quota batch as making “the 2026 total allowance 6% higher than last year”, a framing its own Oct. 28 report does not use. Link
Reuters, Oct. 28, 2026, on the quota itself: a fourth batch of “nearly 4 million tons of fuel export quotas” for 2026, with the total for the year at roughly 40 million tons. Syndicated renderings of the same dispatch state that the total is level with the prior year, not 6 percent above it. Both statements are Reuters, eight days apart, and the difference is disclosed in the body. Link
Sparta Commodities, June Goh, Oct. 30, 2026, “Confusing signals from China”, on how much of the quota becomes cargo: “The implied monthly exports for the remaining of the year in order to fully utilise the quota is roughly 6 mt for Nov and Dec, which is significantly more exports than the last 2 months.” And the firm view on the price move: “we do not believe that China will hit such high clean product export into December and the current dips in SG 10 cracks and spreads are a buy.” Link
G7 leaders statement, Oct. 2, 2026, the release language in full: “we will implement our commitments with a coordinated release through the IEA of 100 million barrels (MB) to begin immediately over four months, including a frontloaded substantial diesel release within the first 20 days by G7 members and partners.” The same statement commits the group to coordinate refinery maintenance “to prevent simultaneous capacity shutdowns” and invites the IEA to monitor “implementation of the March 2026 commitments”. Link
Euronews, Oct. 8, 2026, quoting an internal document on what the 100 million barrels actually is: “Of its 400 million barrels, 326 million have been released. Because some members over-delivered, the 100 million barrels in the G7 statement can be covered within the existing action if everyone fulfils their commitments.” The pledge therefore largely completes an earlier, unfinished release rather than adding 100 million new barrels. Link
U.S. Department of Energy, Oct. 29, 2026, on the final U.S. tranche: contract awards for “an exchange of more than 40 million barrels of crude oil from the Strategic Petroleum Reserve”, which “complete our commitment to release 172 million barrels from the Strategic Petroleum Reserve”. Companies borrow the barrels and return more than they took: DOE says it has secured the return of “more than 216 million barrels… including 44 million additional premium barrels”. Link
U.S. Energy Information Administration, Short-Term Energy Outlook, Oct. 6, 2026, the sentence that matters most for anyone expecting relief at the pump: “Decreases in wholesale crack spreads will not immediately translate into lower retail prices.” EIA goes on: retail and distribution margins “have been depressed because of surging wholesale prices, but we expect them to increase back above the five-year average in 2027 after wholesale prices begin to decrease.” Link
U.S. Energy Information Administration, Winter Fuels Outlook 2026-27, Oct. 6, 2026, on why heating oil is the sharpest edge of this: “Homes that use heating oil as their main heating fuel, about 3% of households, could see the largest increase in spending this year. We expect a 21% increase in heating oil expenditures compared with last winter, driven by increasing global crude oil and distillate prices.” Link
U.S. Energy Information Administration, Winter Fuels Outlook 2026-27, on the mechanism, in the agency’s own words: “Global production of distillate fuel, which includes heating oil, has dropped because of reduced global refining activity. This has caused rising international prices, driving up both the cost to import distillate to the United States and increasing demand for distillate exports from the United States.” Link
General Index, “September Pricing Analysis – Asia Middle Distillates”, Oct. 5, 2026, the third tenor: gasoil “averaging $74.35/bbl vs $67.43/bbl” in September against August. This is the M1 gasoil crack to Dubai, a different tenor from the Platts second-month swap average of $72.97 for the same month, and the two are not interchangeable. Link
C. Full data tables, with as-of dates
C1. Brent crude futures curve, settlements of Friday Oct. 30, 2026, dollars a barrel. Dec 2026 expired that day; the step to Jan 2027 is a contract roll and not a price move.
| Contract | Settlement | Contract | Settlement | Contract | Settlement |
| Dec 26 (expired) | 117.64 | May 27 | 100.61 | Sep 27 | 92.29 |
| Jan 27 | 113.43 | Jun 27 | 98.22 | Oct 27 | 90.72 |
| Feb 27 | 109.56 | Jul 27 | 96.03 | Nov 27 | 89.35 |
| Mar 27 | 106.19 | Aug 27 | 94.06 | Dec 27 | 88.11 |
| Apr 27 | 103.24 |
Source: CME Daily Bulletin, Energy Futures Products, session of Oct. 30, 2026, cross-checked against the ICE contract table and CommodityScope. Dec 26 to Dec 27 spread $29.53; Jan 27 to Dec 27 $25.32; Dec 26 to Jan 27 step $4.21. Every settlement triple-confirmed to the cent.
C2. Crack spreads, Oct. 27, 2026, dollars a barrel, all calculated against WTI Cushing spot. These are Energy News Beat subtractions from EIA spot assessments, not Platts or exchange crack assessments.
| Spread | Value | Inputs |
| Gulf Coast ULSD, single product | 96.84 | GC ULSD $4.767/gal x 42 less WTI $103.37 |
| Gulf Coast 2-1-1 | 61.86 | (GC gasoline $3.101 x 42 + GC ULSD $4.767 x 42 – 2 x WTI) / 2 |
| New York Harbor 3-2-1 | 41.18 | (2 x NYH gasoline $2.819 x 42 + NYH ULSD $4.687 x 42 – 3 x WTI) / 3 |
| Gulf Coast 3-2-1, same day | 50.20 | For comparison: the blended margin is roughly half the diesel-only margin |
| Same spread, Jan. 2, 2026 | 25.32 | Gulf Coast ULSD crack, the year opening |
Source: EIA daily spot series for Gulf Coast and New York Harbor ULSD and conventional gasoline, and WTI Cushing, all for Oct. 27, 2026. Formula and inputs shown so that any reader can reproduce every figure. A Platts or Argus assessed crack uses different crude legs and will not print these numbers.
C3. Singapore gasoil cracks, two assessment families and three tenors, dollars a barrel. Series are listed separately and never averaged. Where a date appears in both families the two values are different assessments and are not a revision of one another.
| Series and tenor | Value | Date or window |
| Platts, second-month swap vs Dubai: 2025 annual average | 18.16 | Calendar 2025 |
| Platts, second-month swap vs Dubai: August average | 64.71 | August 2026 |
| Platts, second-month swap vs Dubai: September average | 72.97 | September 2026 |
| Platts, second-month swap vs Dubai: record high | 83.02 | Sept. 16, 2026 |
| Platts, second-month swap vs Dubai: earlier record | 71.61 | Aug. 19, 2026 |
| Platts, second-month swap vs Dubai: latest assessment | 66.91 | Oct. 20, 2026 |
| Reuters daily spot assessment vs Dubai: record high | 85.63 | March 30, 2026 |
| Reuters daily spot assessment: pre-war print | 21.90 | Feb. 27, 2026 |
| Reuters daily spot assessment: three-month low | 54.00 | Oct. 30, 2026 |
| General Index M1 gasoil crack to Dubai: September average | 74.35 | September 2026 |
| General Index M1 gasoil crack to Dubai: August average | 67.43 | August 2026 |
Sources: Platts second-month Singapore gasoil swap crack against Dubai swaps, as reported by S&P Global and carried by IndexBox on Oct. 22, 2026 and Hellenic Shipping News on Sept. 10, 2026. Reuters daily gasoil crack assessments, GO10SGCKMc1, as reported Oct. 30, 2026 and in Clyde Russell columns. General Index, September Pricing Analysis, Asia Middle Distillates, Oct. 5, 2026, for the M1 crack to Dubai. Three different tenors and two different price reporting agencies appear in this table. The Sept. 16 record and the March 30 record are records in their own series, not two readings of one series, and no figure here is an average of two of them. The $72.97 and $74.35 September averages are four days and one tenor apart and are not a revision; they measure different things.
C4. China crude imports by origin, September 2026, million tonnes as customs reports them and thousand barrels a day at 7.3 barrels a tonne. These are the eleven origins the published sources carry: the ten in the Reuters wire table, plus Canada. Customs reports origins individually rather than as a residual line, so the further origins are listed in the note by name, not estimated. The residual is a residual, not a size category; one of those nine origins may be a pipeline supplier larger than several of the ten named here.
| Origin | Million t | Thousand b/d | Origin | Million t | Thousand b/d |
| Russia | 9.94 | 2,419 | Brazil | 5.15 | 1,252 |
| Iraq | 4.84 | 1,177 | UAE | 3.00 | 730 |
| Saudi Arabia | 2.70 | 657 | Indonesia | 1.72 | 419 |
| Kuwait | 1.62 | 394 | Oman | 1.22 | 298 |
| Malaysia | 1.16 | 282 | Angola | 0.93 | 227 |
| Canada | — | 336 |
Sources: China General Administration of Customs, September 2026 release of Oct. 20, 2026, as reported by Reuters and reproduced with the full origin table, in tonnes, by Interfax. The China origin figures are converted from Chinese customs tonnages published by Reuters, at 7.30 barrels per tonne over 30 days, the factor that reproduces the published 37.096 million tonne total as 9,027 thousand barrels a day. Tonnages are as customs publishes them, rounded to two decimals. Canada’s September rate is published directly by Interfax from the same customs data, though no tonnage is printed for it. The barrel column follows the published rate for each origin rather than a fresh re-conversion, which is why it can sit a barrel or two away from a straight multiplication: 1.22 million tonnes of Omani crude at 7.30 barrels a tonne over 30 days gives 297 thousand barrels a day against the published 298, and 0.93 million tonnes of Angolan gives 226 against 227. Year on year, on the rate basis Interfax prints beside each origin: Russia +20 percent, Brazil +21, Iraq -19, UAE +5, Saudi Arabia -62, Indonesia -19, Kuwait +71, Oman -54, Malaysia -70, Angola -57. Brazil is the one figure here that differs from a percentage circulating elsewhere: the tonnage wire carries +18, on 5.15 million tonnes against 4.36, while Interfax prints Brazil at 1,252 thousand barrels a day against 1,037, which is +20.7 percent. The rate basis is the one every other figure in this sentence uses, so +21 is the figure that belongs beside them. Month on month, Iraq imported 3.6 times what it did in August: 1,177 thousand barrels a day against 327. That is +260 percent on a rate basis and +248 percent on a tonnage basis, and the two are the same observation rather than a disagreement, because August has 31 days and September 30 — 3.60 times 30/31 is 3.48, the tonnage ratio exactly. Both numbers are correct in their own unit; this piece states the multiple because it needs no base. Customs recorded no crude imports from the United States, Venezuela or Iran in September, the same as a year earlier, and imported crude from 20 countries and regions. The ten wire-table origins account for 32.28 of the 37.096 million tonnes, 87.0 percent, or 7,855 thousand barrels a day at 7.30 barrels a tonne over 30 days. Canada adds 336 thousand barrels a day, which takes the named total to 8,191 thousand barrels a day against the published 9,027 — 90.7 percent. That leaves 836 thousand barrels a day, 9.3 percent, across nine further origins — Colombia, Ecuador, Congo, Qatar, Kazakhstan, South Sudan, Cameroon, Egypt and Mongolia — which Chinese customs reports individually in its own release but which the published origin table did not carry. Against the ten origins alone the gap is 1,172 thousand barrels a day, 13.0 percent, and Canada’s 336 is the difference between the two figures. This piece does not split the remainder and gives no rate for any of the nine. A pipeline origin inside that block is a plausible explanation for part of the gap of that shape between the customs total and the seaborne tracker figures.
C5. U.S. distillate stocks and refinery utilisation, 2026.
| Measure | Value | As of |
| U.S. distillate ending stocks | 102.8 million bbl | Week ending Oct. 23, 2026 |
| Five-year same-week average, 2021-2025 | 114.050 million bbl | Computed by ENB |
| Shortfall against that average | 9.8 percent | Week ending Oct. 23, 2026 |
| East Coast (PADD 1) distillate | 32 percent below seasonal average | September 2026 |
| Refinery utilisation, May-September average | 95.4 percent | 2026, highest since 1998 |
| Refinery utilisation, week of Oct. 23 | 92.8 percent | Post-turnaround |
| U.S. refining capacity change since 2019 | down 4 percent | EIA |
Sources: EIA Weekly Petroleum Status Report for the week ending Sept. 11, 2026, released Sept. 16, 2026; EIA Short-Term Energy Outlook, petroleum products section, released Oct. 6, 2026; and EIA weekly series WDISTUS1, WDISTP11 and WPULEUS3 for the week ending Oct. 23, 2026. EIA’s Weekly Petroleum Status Report for the week ending Sept. 11 put national distillate stocks at 107.9 million barrels, 13 percent below the five-year average. The 32 percent figure is the East Coast (PADD 1) comparison for September in the Short-Term Energy Outlook. Both are measured against five-year averages; one is a national week and one is a regional month. The East Coast being roughly two and a half times further below normal than the country is the point. The 9.8 percent is Energy News Beat’s own arithmetic from EIA weekly values for the week to Oct. 23, national stocks, and is not an EIA statement: 102.824 million barrels against a same-week 2021-2025 mean of 114.050, a shortfall of 9.84 percent. Two numbers are easily confused here. 107.9 divided by 0.87 implies a five-year mean near 124.0 million barrels. The 124.7 million barrels printed for the week of Sept. 12, 2025 is the year-ago week, not a five-year average, and is not used as one anywhere in this article. The 17.3 million barrels a day of crude throughput at 96.8 percent utilisation, distillate production of 5.2 million barrels a day and distillate imports of 114,000 barrels a day are all from the same Sept. 11 report.
C6. U.S. residential and wholesale heating oil, week of Oct. 26, 2026, dollars a gallon, excluding taxes, with the year-earlier comparison. Residential and wholesale are separate EIA series and are not the same barrel at two points in a chain.
| Series | $/gallon | Detail |
| U.S. residential heating oil | 6.233 | Up $0.024 on the week and up $2.636, or 73 percent, from a year earlier |
| U.S. wholesale heating oil, reseller | 5.318 | Down $0.005 on the week and up $2.750 from a year earlier |
| Wholesale to residential difference | 0.92 | Energy News Beat arithmetic: $6.233 less $5.318. Taxes and distribution, not a margin earned by one company |
| East Coast | 6.234 | Central Atlantic $6.315, Lower Atlantic $5.955 |
| New England | 6.165 | Subregion of the East Coast |
| Maine | 6.040 | Lowest in the East Coast range |
| New York | 6.441 | Highest in the East Coast range |
| Midwest | 6.222 |
Sources: EIA Heating Oil and Propane Update, week of Oct. 26, 2026, and the EIA weekly residential heating oil series, accessed Nov. 1, 2026. Every price in this table excludes taxes. EIA publishes the year-on-year change in dollars, and the 73 percent is Energy News Beat’s own arithmetic on EIA published values, not an EIA percentage. The year-earlier figure is derived, not printed: $6.233 less the $2.636 that EIA publishes as the change. No monthly state-level heating oil history is published on a consistent basis, so this table compares one week with the same week a year earlier and does not plot a series. Retail diesel is a different product on a different tax basis. It is reported in the body and in the quarterly table below and is deliberately not mixed into this table.
C7. U.S. retail diesel, annual averages and the 2027 quarterly path, dollars a gallon, EIA Short-Term Energy Outlook of Oct. 6, 2026. The 2027 quarters are a forecast, not an outcome, and no account of why they decline is offered here because none is published.
| Period | $/gallon | Basis |
| 2024 annual average | 3.76 | History |
| 2025 annual average | 3.66 | History |
| 2026 annual average | 5.19 | Forecast |
| September 2026 | 6.29 | Monthly, the latest print |
| 2027 Q1 | 4.92 | Forecast |
| 2027 Q2 | 4.57 | Forecast |
| 2027 Q3 | 4.30 | Forecast |
| 2027 Q4 | 4.18 | Forecast, the lowest quarter of the year |
| 2027 annual average | 4.49 | Forecast |
Source: EIA Short-Term Energy Outlook, October 2026, Table 2, Energy Prices, row “On-highway Diesel Fuel,” 2027 columns, released Oct. 6, 2026. The annual average falls from $5.19 in 2026 to $4.49 in 2027, a 70-cent decline spread across four quarters rather than four weeks. Q2 at $4.57 is not the low point of the 2027 path; Q4 at $4.18 is. No seasonal or other explanation for the shape of the quarterly path is offered, because EIA publishes none and this article claims none.
D. Methodology notes
- A claim is treated as documented only where a named government, company or institution states it on the record, and where that document could be opened. Press accounts working from anonymous sources are reported as press accounts and labelled in the sentence where they appear.
- Every crack spread in this article is an Energy News Beat calculation from EIA daily spot assessments, subtracted against WTI Cushing spot. They are reproducible from the formulas printed in Appendix C and in the caption of Chart 1. They are not Platts, Argus or exchange crack assessments, and a reader pulling a Platts screen will see different numbers on a different basis.
- The Singapore and Dubai-linked figures are a separate assessment family from the American ones: different crude leg, different price reporting agency, different market. The rule this article follows is narrower than “never touch the two together”, and it is stated here so a reader can hold the piece to it. The two families are never averaged or blended into a single margin, and neither is presented as a traded spread. Where both appear side by side, any stated difference is an arithmetic illustration of divergence, labelled as such, computed from the two named series and reproducible by the reader. The $33.55 in Chart 2 is exactly that: the Gulf Coast September average of $107.90 less the M1 gasoil crack to Dubai September average of $74.35, both named on the chart, both sourced, and no reader should read it as the price of a tradeable spread or as a claim that a barrel of diesel was “worth” more in Texas.
- Two Singapore gasoil series exist and this article carries both. The Platts second-month swap crack against Dubai swaps and the Reuters daily spot assessment are different tenors from different price reporting agencies, and each has its own record on its own date: $83.02 on Sept. 16 for the Platts second-month swap, $85.63 on March 30 for the Reuters assessment. A third figure, $74.35, is the M1 gasoil crack to Dubai from General Index, which is the one carried in Chart 2 and in Appendix C3. The three are never averaged, never spliced into one line and never presented as revisions of each other. Chart 3 plots the Platts second-month swap and the Reuters daily spot as separate marker sets with the assessment basis named in the legend. The $18.16 in the same table is a 2025 annual average rather than a pre-war print, which is the pre-war figure $21.90 on Feb. 27. Chart 2 names its tenor for a reason: the General Index September average of $74.35 is the first month, and on the second month the same September comparison would print $34.93 rather than $33.55, because the M1-to-M2 spread widened over the summer.
- Where two tracking houses publish different numbers for China, both are reported, each is named, and the construction is stated so a reader can see why they differ. On September stock draws Reuters reports both totals side by side: Vortexa 57 million barrels, Kpler 47.5 million, each the largest monthly draw in its own house’s series. They are not averaged and neither is chosen as correct. On October arrivals the definitions differ rather than the conclusion: Vortexa puts September seaborne imports at 7.6 million barrels a day against a customs total of 9.03 million, which is seaborne against all arrivals including pipeline and is not a conflict, while Kpler’s fourth-quarter seaborne range of 8.0 to 8.5 million barrels a day is a forecast. Every October China figure in this article is a tracker estimate or an expectation. China customs publishes October on Nov. 10, 2026, and that release is the test of the claim that China is back.
- The percent-of-sessions figure for the New York Harbor 3-2-1 is The Vault Report’s own calculation on its own series construction. The percentile reproduces independently against EIA data, but the vendor session count of 10,146 does not reconcile with the 7,824 usable EIA daily observations in the same window. The percentile is therefore attributed to the vendor and the session count is not printed.
- Spot and futures are kept strictly apart. EIA Dated Brent is a physical spot assessment; ICE Brent is a futures contract that expired on Oct. 30. They are different instruments on different dates and the article never blends them into a single price.
- The $4.21 step between the December 2026 and January 2027 Brent contracts is a contract roll, not a price move. This is stated in the body, restated in the Chart 5 caption, and restated again in the Appendix C table, because two different numbers are circulating as today’s price and both are correct for their own contract.
- The OPEC middle distillate figure of 0.4 million barrels a day is described in the text as potential incremental output at an assumed 90 percent utilisation, which is what OPEC’s table says. It is a modelled capacity-potential figure, not observed production, and the article does not describe it as output that will happen.
- The China barrel figures are all conversions from tonnes, and the conversion factor is printed beside them. Customs publishes tonnes only. The 7.30 barrels per tonne factor is the one that reproduces the published total exactly; agencies that use 7.33 get a number that rounds to the same 9.03 million barrels a day but is not the same arithmetic.
- The Kpler and Vortexa October estimates are running estimates and forecasts, not settled measurements, and the customs series is the only settled one. Kpler publishes its September draw as a rate, about 1.6 million barrels a day, and states that it is the fastest on record and more than double the May to August pace, against a previous record of 950,000 barrels a day in October 2017. Those two figures are Kpler’s, not Energy News Beat’s; the article attributes them and does not convert the rate into a total, because Reuters publishes Kpler’s total of 47.5 million barrels directly.
- The Persian Gulf shipping data is tanker tracking, not customs data. Chinese customs have reported no Iranian-origin imports since 2020, so every Iranian volume in this article is a tracking estimate and is attributed to the tracking house that produced it.
- The claim that no European crude refinery restarted in 2026 is stated in its strict form, which survives testing, and is accompanied in the same paragraph by the two caveats that break the absolute form. BP delayed the permanent closure of a 70,000 barrel a day crude unit and a 40,000 barrel a day vacuum unit at Gelsenkirchen, reported by Industrial Info Resources, and the plant then changed hands rather than closing; and Ludoil has announced recommissioning of decommissioned units at Priolo with no date. The claim is not stated as an absolute anywhere, and the Gelsenkirchen deferral is not attributed to bp.com, which is cited for the sale only.
- The Presidential Determination cited is 2027-01, signed Oct. 22, 2026 and published Oct. 28, 2026 at 91 FR 68011. It is not 2026-11, which was signed in April and carries a different citation. The Energy Department’s own press release cross-references the April number while describing the October action, which is the likely origin of the error and is why both determinations appear in Appendix A.
- The Iraq section reports a negative finding as a negative finding. Repeated searches found no Venezuela-style escrow, revenue-sharing arrangement or Treasury-directed account applied to Iraq, and the article says so. It does not infer that such a mechanism exists because the underlying leverage does.
- Nothing here was generated by a model or read off a chart. The publish kit accompanying this piece lists every number in the text against its source row, and a script checks that none is missing.
- The July 2026 Arab Light official selling price and the November one are the same document type in different months, and neither is compared with an expectation range, because no published survey of expected changes was found. Where the article says a cut was the widest since June 2020 it is quoting the OSP itself.
- The OPEC utilisation figures are one table read at two scopes. Global 2025 utilisation is 80.8 percent, and the regional rates for the same year are US & Canada 93.8, Europe 82.9, China 82.8, Middle East 76.5, Latin America 59.1 and Africa 55.1. The point the article makes from them is that the spare capacity in the aggregate is not in the Atlantic basin, so a global headroom figure and an Atlantic product shortage are not in tension. India’s 103.5 percent is not used, because it reflects a capacity base that runs above nameplate and would need its own explanation.
- The E.O. 13303 chain is described in full because three of its four links are routinely dropped. E.O. 13303 of May 22, 2003, 68 FR 31931, prohibited attachment against the Development Fund for Iraq, Iraqi petroleum and proceeds until title passes, and Central Bank of Iraq property. E.O. 13364 of Nov. 29, 2004, 69 FR 70177, rewrote section 1 and named the Central Bank of Iraq accounts expressly, which is where the account at the New York Fed first enters the shield. E.O. 13668 of May 27, 2014, 79 FR 31019, terminated section 1 as amended by E.O. 13364 and left “immunities … under otherwise applicable law”. OFAC then removed the implementing regulation, 31 CFR 576.206, by final rule of Dec. 28, 2017, 82 FR 61450. The reason the error reproduces in careful writers is visible on OFAC’s own Iraq-Related Sanctions page, which still lists the 2003 Oil Proceeds Receipts Account guidance among its interpretive documents although the regulation carrying that protection was deleted in 2017. A second document reproduces the same confusion. The continuation of the national emergency with respect to Iraq, 91 FR 25071, published May 7, 2026, keeps the emergency alive for another year and cites E.O. 13668 among the orders it relies on, so a reader who stops there sees the order that ended the shield named as though it were still doing work. Part 576 survives as a program covering cultural property and blocked persons; what it no longer contains is attachment protection for the account.
- The Gelsenkirchen deferral is attributed to Industrial Info Resources, which reports that BP delayed the planned permanent closure of a 70,000 barrel a day crude distillation unit and a 40,000 barrel a day vacuum distillation unit and that it was the second time closure plans had been reversed while the company looked for a buyer. Bloomberg of July 8, 2025 corroborates the commercial reason. bp.com is cited only for the sale, agreed March 19, 2026 and completed Aug. 3, 2026. The 70,000 barrels a day is one crude unit, not the 265,000 barrel a day refinery.
- The $2.72 and $11.38 in this article are M1-minus-M2 spreads on General Index’s Singapore gasoil curve, not a Gulf Coast-to-Singapore margin and not a traded spread. In August the M1 crack to Dubai averaged $67.43 and the second month $64.71, a spread of $2.72; in September they were $74.35 and $72.97, a spread of $11.38. M1 above M2 is backwardation, and General Index states that the forward curves for both products stayed backwardated through the period. The spread widening while the absolute crack rose is a curve observation, nothing more.
E. Could not verify
Listed plainly so that nothing here reaches air or print as settled fact. Each item is either absent from the article or reported in the text as what it is: an estimate, a tracker figure, a single-source report, or a question this piece could not close.
- A published rate for any of the nine further origins that supplied China in September beyond the ten the wire table carried. Chinese customs reports every origin individually in its own release, and the ten in Appendix C4 plus Canada account for 8,191 thousand barrels a day of the 9,027 the customs total converts to, leaving 836 thousand barrels a day, 9.3 percent, across Colombia, Ecuador, Congo, Qatar, Kazakhstan, South Sudan, Cameroon, Egypt and Mongolia. That remainder is left undivided and no rate is given for any of the nine. Two attempts to attribute part of it were abandoned. A Qatar figure derived from a published Middle East total does not survive arithmetic, because the named Middle East origins in the table already sum to more than that total. And a Colombian rate cannot be built from the DANE export series, which reports 2.50 million barrels for January to August as a cumulative total rather than a monthly rate. Neither is used.
- An annual series for that residual, which would show whether the residual origins are growing. Only the September figure is available at this level of detail, so the article uses one month and makes no claim about a trend.
- The specific survey range or expectation poll behind the claim that Saudi Arabia was expected to raise November prices. Reuters framing is that the cut was unexpected, but no published survey, poll or expectation range was found on Reuters, Zawya, Argaam, Bloomberg or the Straits Times, and the phrase “against expectations of a rise” was therefore removed from the article rather than reworded. The OSP itself, $5.00 under Oman/Dubai and the widest since June 2020, is confirmed and stands.
- A centcom.mil press release carrying the $25 billion / 100 day language. The claim is carried as a CENTCOM social-media statement and in media reports, and Adm. Brad Cooper said the same in a video statement on Oct. 16. The article attributes it accordingly.
- The individual titles of the four Shandong buyers named in the Reuters report on Iraqi crude purchases in October. The buyers are named in the source; their corporate structures are not, and the article does not characterise them further.
- Whether Ludoil will actually recommission the decommissioned ISAB distillation and desulfurisation units, or when. The plan is announced, no date is disclosed, and nothing has been executed. The article says so in the same sentence where it raises the possibility.
- Whether the Yulong 400,000 barrel a day complex is the single cause of the record ESPO premium. It is one of two named major takers, and traders cite the loss of Iranian barrels, freight and competition between buyers. No source attributes the premium to Yulong alone, so neither does this article.
- Whether the G7 pledge of “up to 100 million barrels” is additive to the March 2026 IEA release or largely completes it. Euronews, quoting an internal document, reports that 326 million of the 400 million pledged in March had already been released and that the 100 million “can be covered within the existing action”. The IEA did not answer Euronews questions on volumes and refined products. The article therefore uses the G7 own number, “up to 100 million barrels”, and states the Euronews qualification in the same paragraph. The G7 statement itself is confirmed to primary text.
- A Reuters or IEA document reconciling the two characterisations of Chinas 2026 clean product export quota total. Reuters on Oct. 30 describes an allowance that makes the 2026 total 6 percent higher than last year; the same agencys Oct. 28 dispatch, as syndicated, describes a total level with 2025; Vortexa describes the annual quota as broadly stable at around 41 million tonnes since 2023. The 6 percent is attributed to the Oct. 30 story and the discrepancy is disclosed in the body rather than resolved.
- A published Kpler total, in barrels, for Chinas September crude stock draw. Kpler publishes a rate, about 1.6 million barrels a day. The roughly 48 million barrel figure in the article is a 30-day conversion computed by Energy News Beat and labelled as a conversion, not a Kpler publication. Vortexas nearly 57 million barrels is a published monthly total on a different construction.
- The exact wording of the customs table as released in English. The origin table is taken from Chinese customs data as reproduced by Reuters and by Interfax, which agree on every tonnage and every percentage; the barrel column is a 7.3 barrels a tonne conversion. No discrepancy was found between the two renderings, but neither is the customs release itself, which publishes in tonnes.
- Whether the last Iranian cargoes discharged in China in late September were loaded in June or later. OilPrice reports that all of the final arrivals had been loaded in June; Kpler reports no loading after Aug. 25. Both can be true if the June-loaded barrels were held afloat, but the article states only the loading cutoff and the arrival cutoff and does not assert a loading month.
F. What the record supports, and what it does not
The argument of the piece, stated in one place so it can be checked line by line against the evidence above.
- Crude is not the constraint. That is now about as well established as a market judgment gets: 103.3 million barrels a day of distillation capacity at 80.8 percent utilisation, 5.3 million barrels a day being added against three hundred thousand of closures, discounted unsold West African cargoes and 415 laden VLCCs sitting in the Atlantic. The barrel is not scarce.
- The constraint is distillate yield, and specifically distillate yield in the Atlantic basin. Four hundred thousand barrels a day of new middle distillate potential worldwide in 2026, against a deficit accumulated over a year, is the arithmetic behind a Gulf Coast diesel crack near one hundred dollars while Singapore has already cracked.
- The IEA objection is serious and unresolved. Record freight at six times last year, and crude delivered at thirty to thirty-five dollars a barrel over the Gulf Coast price, genuinely does explain why European and Asian margins collapsed while American margins rose. What it does not explain is why the same sea lanes produce opposite outcomes for the product. A freight shock and a yield constraint can both be operating, and this article argues the record shows both.
- The curve says relief next year and the curve has been wrong before. Twenty-nine dollars and fifty-three cents of backwardation from December 2026 to December 2027 is the market expectation, not an outcome, and it depends on conditions the IEA names explicitly: a recovery of product supply from the Middle East.
- Europe has changed direction. It has not changed facts yet. A high-level dialogue, a six-state non-paper and a Commission commitment to raise refining output are real and quotable. No closed refinery has restarted, and the one plan that would genuinely bring back decommissioned units has no date.
- On Iraq, the leverage is real and the controls are not. Iraqi oil dollars sit at the New York Fed and the Treasury has used that lever twice this year. But no Venezuela-style mechanism exists, Iraqi crude keeps flowing east, and the one action taken against an Iraqi oil official was a sanction for diverting barrels to Iran, which is close to the opposite of the thesis.
- What to watch: the Gulf Coast diesel crack, whether Atlantic basin freight normalises, whether any European unit actually restarts, and whether the Middle East product supply the IEA is counting on materialises in the first quarter of 2027.
- Asia has a release valve and the Atlantic does not. A Chinese export quota can be issued, and Asian cracks fell within two days of the fourth batch. No government can issue a quota for a distillation column. That asymmetry, not the price of crude, is the mechanism the article describes.
- The two release valves now in play, a Chinese quota and an IEA stock release, buy time and make no diesel. A reserve release moves an existing barrel out of a tank; a quota lets an existing refinery sell abroad. Neither adds refining capacity to the Atlantic basin, which is why the American diesel crack was still near $97 two days after both were in play.
G. Corrections to figures in circulation
Numbers that are being repeated and should not be, with what the record actually supports. Several of these appeared in early drafts of this article and were corrected before publication.
- Claim: Gulf Coast diesel crack of $96.84 is a Platts assessment.
Correction: It is an Energy News Beat subtraction from two EIA daily spot assessments: Gulf Coast ULSD at $4.767 a gallon times 42, less WTI Cushing at $103.37. The arithmetic reproduces to the cent. A Platts-assessed crack uses different crude legs and will not print $96.84.
- Claim: The Singapore gasoil crack peaked above $100 and is now three times its pre-war level.
Correction: Both halves are wrong. The Singapore gasoil crack against Dubai peaked at $85.63 on March 30, 2026. The $100-plus figure widely quoted, $102.20 on Aug. 17, is the U.S. diesel crack against WTI, a different market. And the pre-war level was $21.90 on Feb. 27, so the current $54 is about 2.5 times it, not three.
- Claim: The Brent curve runs $95.77 for June 2027 and $87.16 for December 2027, a $26.72 front-to-year-out spread.
Correction: The settlements were $98.22 for June 2027 and $88.11 for December 2027. The quoted spread is also arithmetically impossible: $117.64 less $87.16 is $30.48. The correct figures are $29.53 from the December 2026 contract to December 2027, or $25.32 from January 2027 to December 2027.
- Claim: Brent fell $4.21 on Oct. 30, from $117.64 to $113.43.
Correction: That was not a fall. December 2026 expired on Oct. 30 and January 2027 became the front month. The $4.21 is a contract roll. Because some data providers have rolled and some have not, two numbers are circulating as today’s price and both are correct for their own contract.
- Claim: The Valero executive who described Gulf Coast to Asia freight was the chief operating officer.
Correction: It was Randy Hawkins, on the third-quarter call of Oct. 22, 2026. Gary Simmons is the chief operating officer and spoke elsewhere on the same call. The figures are exact: “around 30 to $35 per barrel” against a “2025 average of around $5.”
- Claim: Three EU member states wrote to Brussels on crude versus product security.
Correction: Six did: Bulgaria, Czechia, Hungary, Italy, Poland and Slovakia, in Council document 14726/1/26 REV 1 of Oct. 28, 2026. It was presented to the Energy Council as an information item and was not adopted.
- Claim: November ESPO cargoes to China cleared at $26 to $27 over Brent.
Correction: Those were offers. The only reported deal was heard at $23 to $26, by one large independent Chinese refiner. Later cargoes were offered above $25, with two above $30. An offer is not a settlement.
- Claim: The Yulong refinery was built to run Russian crude and is driving the ESPO premium.
Correction: Yulong is a 400,000 barrel a day crude-to-chemicals complex built for light sweet crude; sanctions pushed it into running almost exclusively Russian grades. It is one of two named major takers alongside Sinopec, and traders attribute the premium to the loss of Iranian barrels, freight and buyer competition as well. No source attributes it to Yulong alone.
- Claim: The refining determination is Presidential Determination 2026-11, signed Oct. 22 and published Oct. 28.
Correction: Two documents are conflated. PD 2027-01 was signed Oct. 22, 2026, published Oct. 28 at 91 FR 68011, and is addressed to the Secretary of War. PD 2026-11 was signed April 20, 2026 and published April 23 at 91 FR 21933, addressed to the Secretary of Energy. The Energy Department’s own release cross-references the April number while describing the October action, which is the likely origin of the confusion.
- Claim: Adm. Brad Cooper said on Oct. 22 that the blockade prevented $25 billion of exports.
Correction: The Oct. 22 statement was a CENTCOM command statement. Cooper made the same claim in a video statement on Oct. 16. Neither is an audited figure; it is a military counterfactual.
- Claim: Chinese buyers took Iraqi crude at deep discounts.
Correction: The official selling prices were discounted by $34.50 and $37 against destination benchmarks, but Chinese independents paid premiums of $12 to $20 a barrel over ICE Brent on a delivered basis for at least 12 million barrels. The discount is on paper at the origin; the delivered price is a premium.
- Claim: U.S. distillate stocks are 32 percent below normal.
Correction: That is the East Coast figure for September, from EIA. Nationally, distillate stocks were 102.8 million barrels in the week to Oct. 23, about 9.8 percent below the five-year average. The two are different scopes and different dates and are kept apart.
- Claim: The IEA says higher refinery output will end the tightness.
Correction: The IEA says the opposite, in terms, and the clause is usually cut: higher output returns gasoil to surplus in the first quarter of 2027, “however, this will be insufficient to offset the deficit accumulated during 2026. As a result, the gasoil market balance will remain tight well into 2027 and is dependent on a recovery of product supply from the Middle East.”
- Claim: The record Singapore gasoil crack is $85.63 and the $100-plus peak was the Singapore crack too.
Correction: Two separate corrections. The $100-plus figure, $102.20 on Aug. 17, 2026, was the U.S. diesel crack against WTI, not the Singapore gasoil crack. Singapore records belong to two assessment families and each must be named: $85.63 on March 30, 2026 is the record in the Reuters daily spot assessment (GO10SGCKMc1), and $83.02 on Sept. 16, 2026 is the record in the Platts second-month swap crack against Dubai, which was itself reported as beating Platts’s own $71.61 record of Aug. 19. Neither number is “the” record without the series attached, and the two are never averaged.
- Claim: $18.16 is the Singapore gasoil crack before the war.
Correction: No. $18.16 is the 2025 annual average for the Platts second-month Singapore gasoil swap crack against Dubai, a normal-year baseline. The pre-war print is $21.90 on Feb. 27, 2026, the last session before the war, in the Reuters daily assessment. Using $18.16 as a pre-war figure overstates the move by about 20 percent and mixes an annual mean with a single dated observation.
- Claim: China has been draining its strategic petroleum reserve to fund the import surge.
Correction: Partly wrong and worth splitting. Kpler reports Chinas onshore crude stocks fell about 1.6 million barrels a day in September, the fastest on record, but the drawdowns were concentrated in commercial inventories while strategic reserves stayed largely untouched. Kpler also has China still holding 1,124 million barrels, about 80 days of refinery requirements. The draw is real; the attribution to strategic reserves is not supported.
- Claim: Saudi Arabia raised November Arab Light to Asia, and the cut was expected to be smaller.
Correction: The direction was a cut, to $5.00 under Oman/Dubai, the widest since June 2020. No published survey or expectation range supporting a specific expected move could be found, so this article states the OSP and its widest-since date and says nothing about what had been expected.
- Claim: The gap between the $74.35 General Index September crack and the $72.97 Platts second-month average was $8.16 of contango.
Correction: $11.38, and it is backwardation, not contango. The two figures are one tenor apart, so the comparison is an arithmetic illustration and not a spread: $74.35 less $72.97 is $11.38. On General Index’s own curve the M1-minus-M2 spread widened from $2.72 in August ($67.43 less $64.71) to $11.38 in September, and General Index states that the forward curves for both products stayed backwardated through the period. M1 above M2 is backwardation in the ordinary sense: the near month is worth more than the far one.
- Claim: National distillate stocks are 13 percent below normal for September.
Correction: That figure is one week, not a month. EIA’s Weekly Petroleum Status Report for the week ending Sept. 11, 2026, released Sept. 16, put national distillate inventories at 107.9 million barrels, up 1.6 million on the week and 13 percent below the five-year average. The 32 percent figure is a different scope again: East Coast, PADD 1, for the month of September, against the 2021-2025 seasonal average, in the Short-Term Energy Outlook. Both are five-year comparisons, which is what makes them comparable despite the different windows. Neither is the 9.8 percent, which is Energy News Beat’s own arithmetic on national weekly stocks for the week to Oct. 23.
- Claim: E.O. 13303 still protects Iraqi oil proceeds from attachment.
Correction: It does not, and neither does the regulation that carried the protection. Section 1 of E.O. 13303 (68 FR 31931), as amended by E.O. 13364 (69 FR 70177), was terminated by E.O. 13668 (79 FR 31019) in 2014, and OFAC removed the implementing regulation, 31 CFR 576.206, by final rule on Dec. 28, 2017 (82 FR 61450). Ordinary sovereign immunity under otherwise applicable law remains. An Iraqi oil proceeds account held at the New York Fed is a real point of operational leverage; it is not a shielded account.
- Claim: $4.49 is the second-quarter 2027 diesel price.
Correction: It is the 2027 annual average in EIA’s Short-Term Energy Outlook of Oct. 6, 2026. The 2027 quarters are $4.92, $4.57, $4.30 and $4.18, against a 2026 annual average of $5.19. Q4 at $4.18 is the low point of the year; Q2 at $4.57 is not. The headline comparison the piece uses is the annual average, $5.19 to $4.49, a 70-cent fall.
- Claim: BP twice deferred a planned closure at Gelsenkirchen, according to bp.com.
Correction: The deferrals are reported by Industrial Info Resources: a 70,000 barrel a day crude distillation unit and a 40,000 barrel a day vacuum distillation unit, with the second reversal occurring while BP looked for a buyer. Bloomberg reported on July 8, 2025 that the crude unit was kept running because the market contributed to the plant’s profitability. bp.com is the source for the sale only: agreement announced March 19, 2026, completed Aug. 3, 2026, 265,000 barrels a day of crude capacity across Horst and Scholven. The 70,000 is one unit, not the plant.
H. A note on what this article is not
- It is not a forecast that prices will fall. It reports what the futures curve and EIA project, and says plainly that the curve is an expectation and that its own stated condition may not be met.
- It is not a claim that refining capacity is the binding constraint. The article says the opposite, in terms, because the opposite is what the data supports: 103.3 million barrels a day at 80.8 percent utilisation, with regional headroom concentrated outside the Atlantic basin.
- It is not a verdict on Stu theses. Both are tested against the record and reported as open questions, with the evidence that supports each and the evidence that cuts against it, and neither is asserted.
- It is not an argument that the IEA is wrong. The agency objection gets its own section, quoted in full, because it is the strongest case against the piece argument.
- It is not investment advice, and the paragraph on refiner margins describes a dispersion that existed at the time of writing, not a recommendation.
- It is not a claim that the two margin families were never subtracted. They are subtracted once, in Chart 2, to illustrate how far apart the two basins ran in September. Appendix D states the actual rule: never averaged or blended into one margin, never presented as a traded spread, and any stated difference labelled as an arithmetic illustration computed from two named and reproducible series.
The post The Atlantic Distillate Trap appeared first on Energy News Beat.