
The quarter Shell lost its Qatari supply was its best since 2022, and not for the reason most people think. Refining paid for it. A portfolio of options made the difference.
By Energy News Beat | Oct. 29, 2026 | Shell results published 7:00 a.m. GMT; LNG prices read 1:00 p.m. CT
Shell earned $10,814 million in the third quarter, against $5,432 million a year earlier and $9,836 million in the second quarter. That is its best since 2022, ahead of the $10.33 billion company-compiled consensus. Shell lifted the buyback to $5.0 billion from $3 billion and generated $16,322 million of free cash flow. All of it in a quarter when the gas it used to lift in Qatar was effectively gone.
The number that explains the quarter
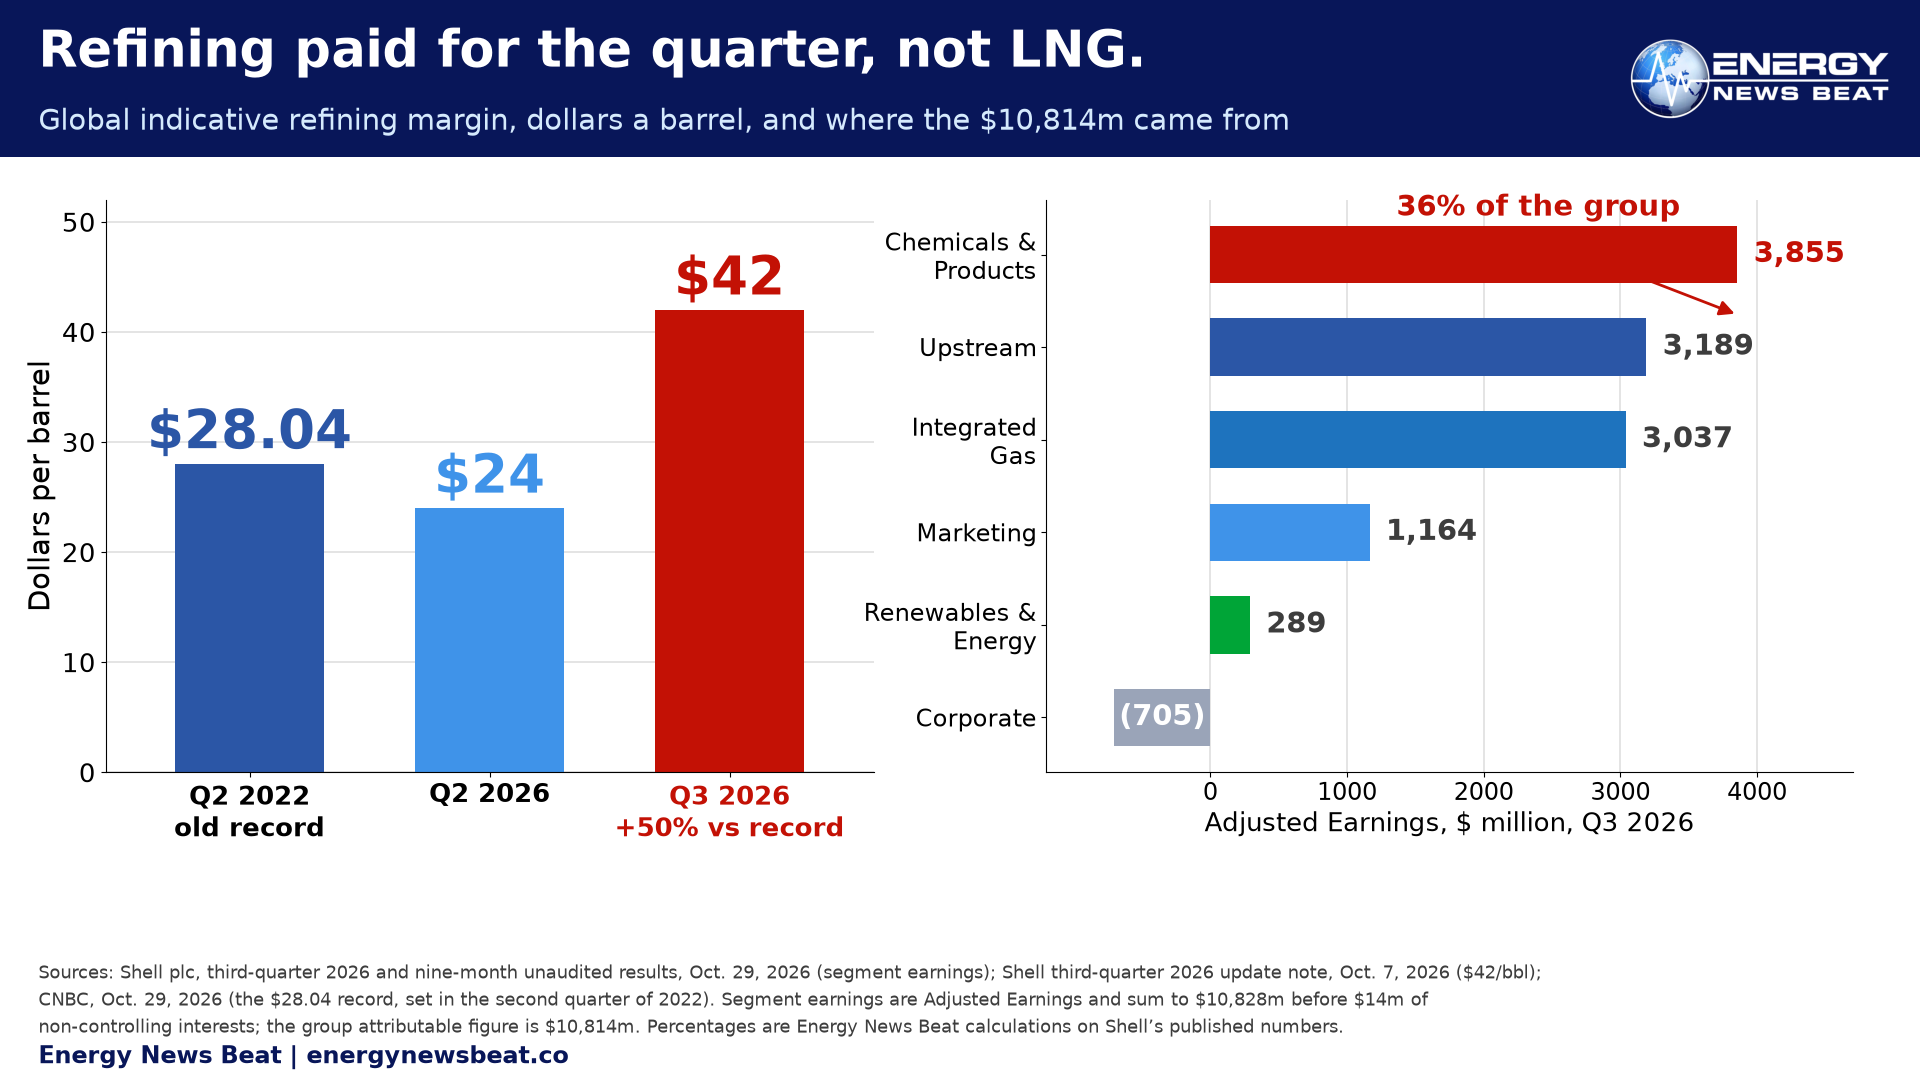
The quarter is not an LNG number. Shell’s global indicative refining margin was $42 a barrel, against $24 in the second quarter and the $28.04 record set in the second quarter of 2022. Half again the old record, flagged in Shell’s Oct. 7 update note rather than sprung on the day. Chemicals & Products earned $3,855 million, 36% of the group total, against $550 million a year earlier, with refineries at 96%.
The LNG line, read precisely
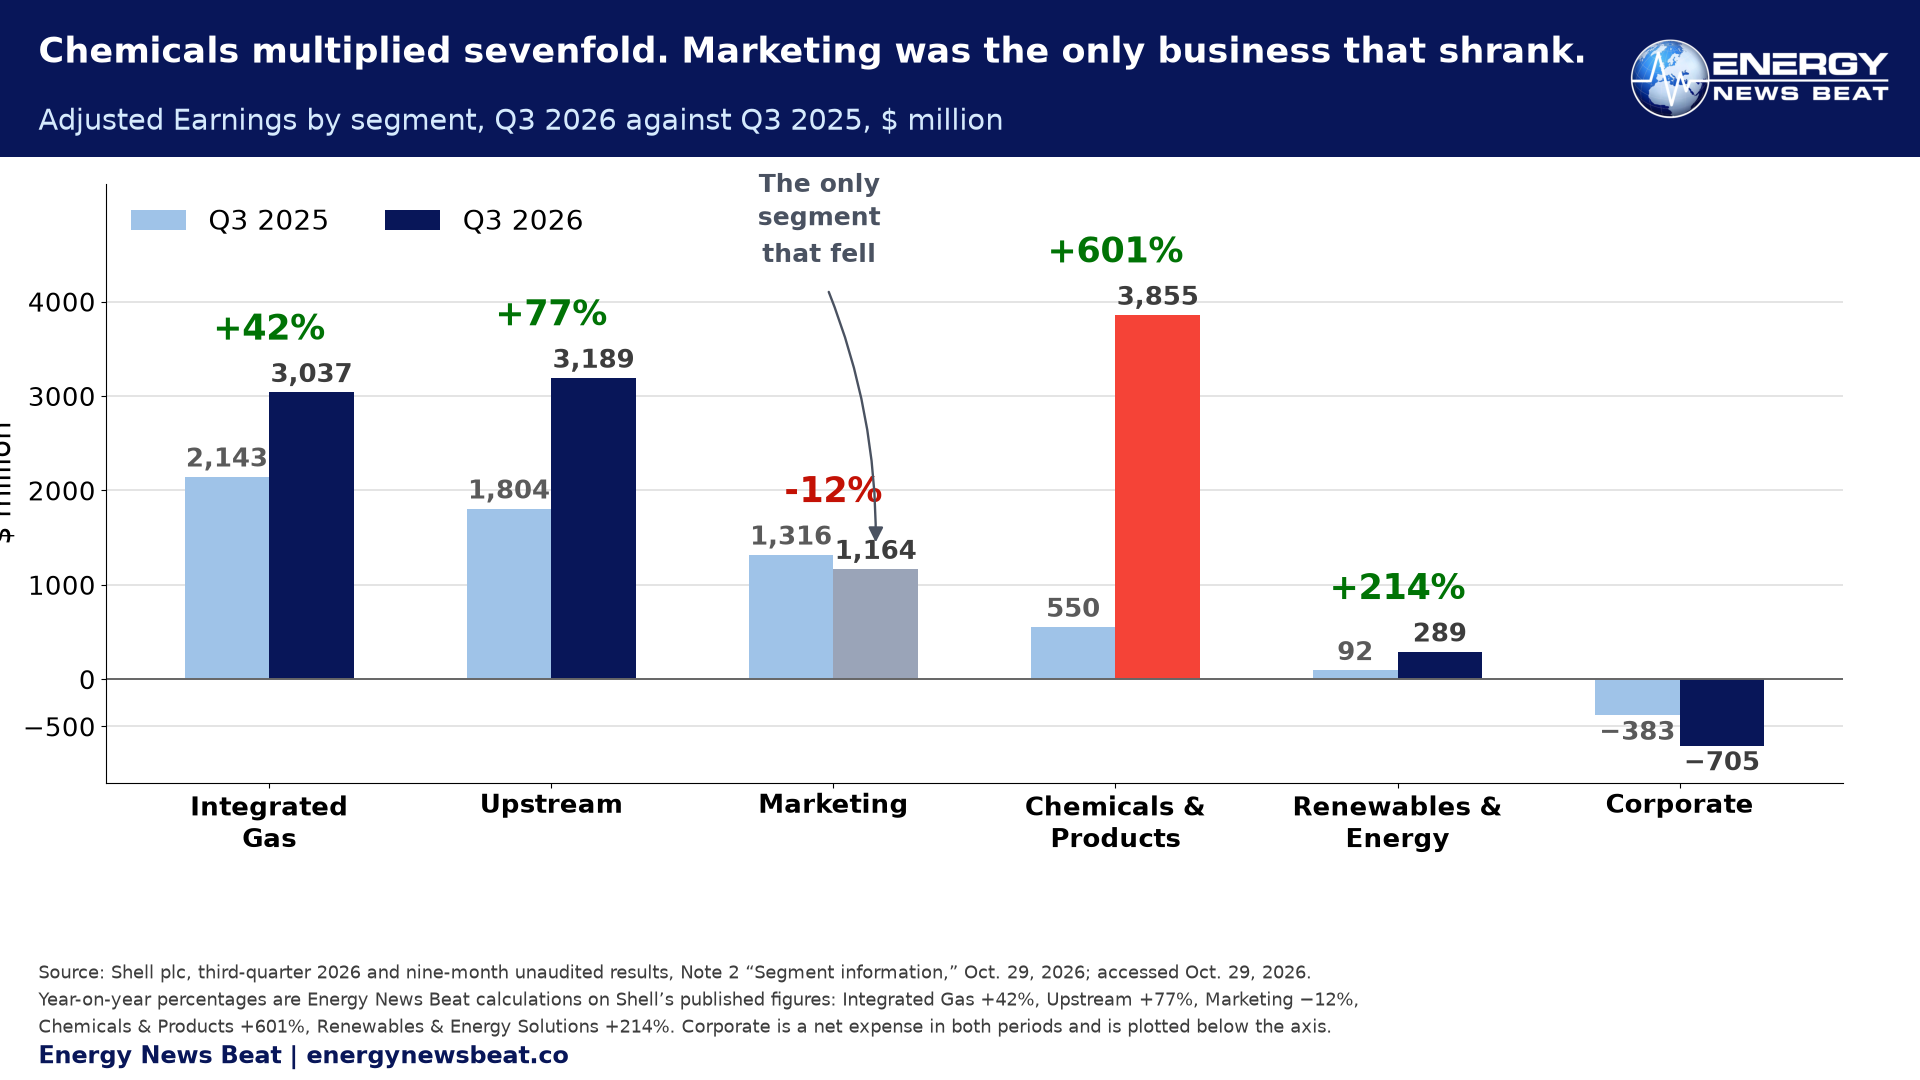
The LNG numbers need a ruler. Over nine months, Integrated Gas rose on “higher contributions from trading and optimisation and higher realised prices (increase of $3,783 million)”, partly offset by “lower volumes (decrease of $1,279 million)”. Nine months. In the quarter itself, Shell’s press release says “Trading and Optimisation was in line with Q2 2026”, exactly as the Oct. 7 note pre-guided, and the group driver list names “lower crude and oil products trading and optimisation” as a drag. Integrated Gas still earned $3,037 million, up 42%, on liquefaction of 7.43 Mt and sales of 19.25 Mt, realised gas at $8.3/mcf against $7.2 and liquids at $69 a barrel against $80. The surge is a nine-month fact, not a three-month one.
What actually happened in Qatar
Qatar did not choose to sit this out. Hormuz closed, and on March 18 and 19 strikes destroyed Trains 4 and 6 at Ras Laffan: 12.8 Mtpa, about 17% of export capacity. Sheikh Saad al-Kaabi put the repairs at three to five years in March, and The National reported on Oct. 29 that he now puts them at about three years. He said Qatar would be “compelled to declare force majeure for up to five years on some long-term LNG contracts”; that force majeure now runs through the end of December. OIES puts around 80% of Gulf LNG out of reach. Qatari exports ran 17.2 Mt from January to July, down 64.3%. Kpler expects 16.5 Mt this winter against 34.5 Mt last. QatarEnergy is not abstaining. It is shuttling cargoes, transferring them ship to ship, running dark through Hormuz, sending one the long way to Poland, and in July it bought 33 US spot cargoes worth about $1 billion to keep customers whole. Sawan called the outage “a short-term event rather than a structural one” in July. Both are right: he meant the undamaged trains, which al-Kaabi says could restart “within a week of a peace deal if ships were available”. The long clock belongs to the two that were destroyed.
The mechanism: options, not a desk
A portfolio is a set of options, and options get valuable when supply breaks. On the Q3 call, CFO Sinead Gorman put the Middle East to China freight route at “10 times what it was” a year ago, framing the advantage in three parts: access to vessels, the cost of freight, and the ability to trade around it. “Number one and number three, it’s certainly been helping us.” The balance sheet agrees: lease liabilities rose $7,684 million in nine months as index-linked vessel leases were remeasured, the accounting fingerprint of a fleet signed before the spike. Sawan described the substitution on Shell’s own Q1 2026 analyst Q&A, a separate call earlier in the year: “LNG Canada stepped up when the Qatari volumes were out.” That is the premise, in the CEO’s voice.
The hedge, tested on the record
JPMorgan’s Matt Lofting asked it almost word for word, whether Shell was experiencing “a degree of natural business hedge” in which lost Middle East volumes create the price dislocations the rest of the business monetises. Gorman did not claim the LNG unit was profiting. She said the impact on Integrated Gas, on Pearl GTL and on “some of the LNG there as well, which will play into Q4 as well” was “not something that is just going away at any point in time”. A headwind, named by the CFO, into the next quarter. Shell had already declared force majeure to its own customers in March. It is victim and beneficiary at once, and the story only works if you hold both.
QatarEnergy’s pivot
Watch what Doha did next. QatarEnergy agreed on Oct. 29 to buy up to 3 Mtpa from Woodside’s Louisiana LNG over 20 years, on top of the 4 Mtpa signed with Cheniere on Oct. 22. It already owns 70% of Golden Pass alongside ExxonMobil. The National calls it the largest buyer of US LNG. The most concentrated LNG exporter on earth, built on one country’s gas, is becoming a portfolio player — Shell’s model.
The winter in front of us
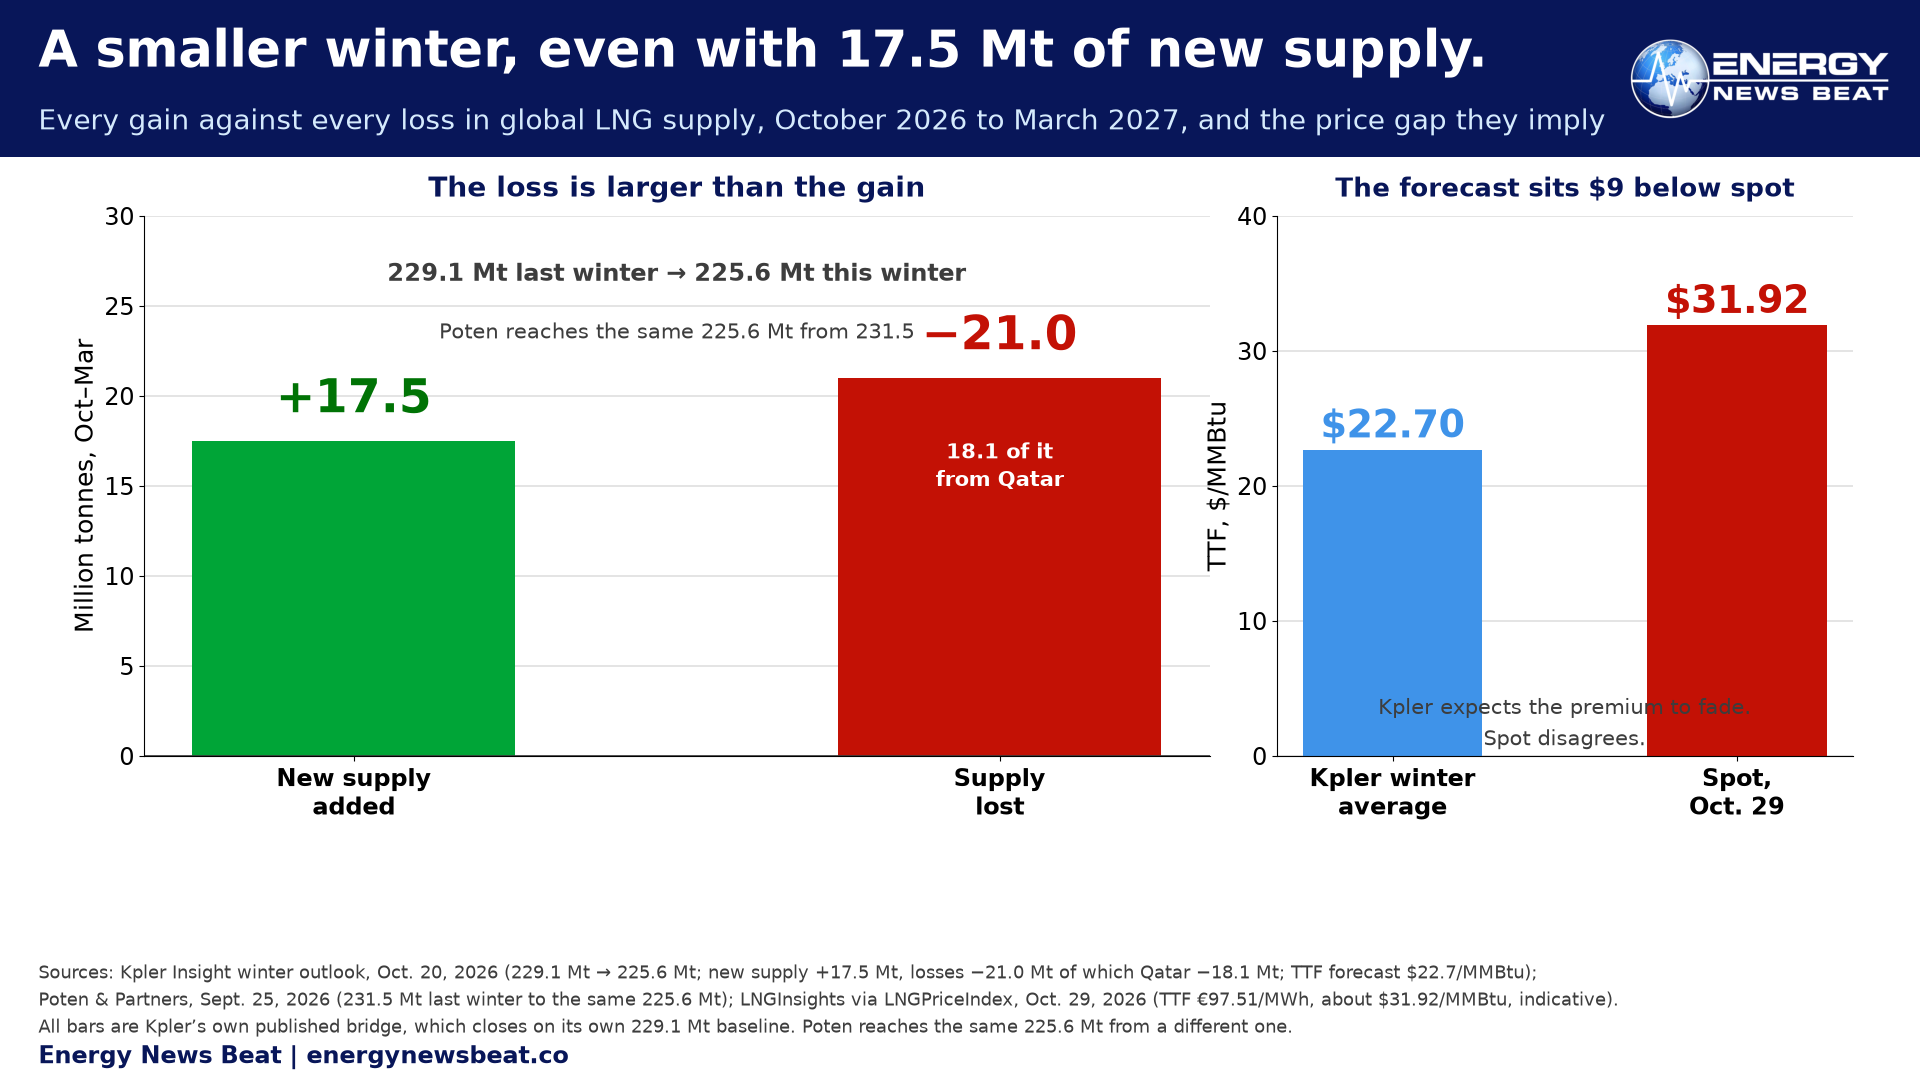
The market QatarEnergy is buying into has not calmed. TTF broke €100 on Oct. 28, the first time since 2022, settling 4.85% higher, then fell 2.27% to €97.51, about $31.92, as Shell’s numbers landed. JKM, an indicative independent estimate rather than the Platts assessment, sat at $33.26; Henry Hub was $2.95. Global LNG supply falls 3.5 Mt to 225.6 Mt this winter: 17.5 Mt of new supply arrives and 21 Mt is lost, Qatar’s 18.1 Mt alone more than every new project on earth added together. Poten reaches the same 225.6 Mt from a different baseline. The IEA says conditionally that a Hormuz reopening delayed past the start of the fourth quarter could trigger the first annual decline in global LNG supply since 2012, while still expecting full-year 2026 roughly flat. The winter call is Kpler’s and Poten’s, not the agency’s. Kpler’s winter average forecast is $22.7 for TTF, well under spot, which implies the premium fades before winter ends.
What it means in a kitchen
India imported 9% more LNG between March and September while losing its two biggest suppliers. Qatar’s share fell from 45% to 3%; the United States, Oman and Nigeria rose from 25% to 68%. “The shift demonstrates India’s ability to secure alternative supply, although maintaining import volumes has required greater exposure to flexible international LNG markets and elevated prices,” said Sonal Ranjan of Kpler. The gas arrived. It cost more.
Fertiliser is where it bites. Yara has curtailed European ammonia production, and its European gas consumption fell more than 7% year on year in the third quarter. Ammonia is fertiliser, and fertiliser is the price of bread two seasons out. OIES states the distributional truth without blinking: “South Asia loses imported gas it can no longer afford, while North Asian importers are largely insulated.” A $33 Asian spot price is a heating bill in Seoul and a skipped meal in Dhaka, and the truck bringing groceries burns the same distillate.
What it means in a portfolio
For an investor, the buyback is the headline and the debt is the fine print. Shell is returning $5.0 billion against net debt of $39,733 million and gearing of 16.6%, or 2.7% excluding leases, inside a policy of 40% to 50% of operating cash flow through the cycle, and paying a dividend of $0.3906, up 9.1%.
Two distortions are coming. A $6.4 billion non-cash pension loss on moving the Dutch defined-benefit plan to defined contribution will hit reported income and leave Adjusted Earnings alone. The second is already inside the debt figure: Shell’s $39.7 billion of net debt includes about $8 billion of non-cash net debt from the variable component of long-term shipping leases, which is why net debt excluding leases is $5.6 billion against a lease book of $34,147 million that was remeasured up $7,684 million in nine months. Read $5.6 billion as the cleaner number, the lease book as the freight bet.
Cash quality matters too. Cash from operations of $21,043 million includes $3.4 billion of derivative inflows, $1.5 billion in Chemicals & Products and $1.9 billion in Renewables, which is margin released rather than earned. Marketing was the only business that shrank, down 12% on weaker Mobility margins and lower Lubricants volumes, not on the $1,904 million biogas impairment — an identified item excluded from Adjusted Earnings, though it did pull reported income down to $55 million from $1,747 million in the second quarter, and against $576 million a year earlier. Production was 2,574 kboe/d and capex guidance narrowed to $23–25 billion.
The case against
The bear case is that all of this is temporary, and the market knows it. OIES finds high prices balance the market “mostly by driving down demand rather than generating additional supply”, and that “the bulk of the upside impact for restrictive scenarios is already priced in”. The futures market half agrees: on Oct. 16, Q1-2027 TTF futures sat at €85.95, or $28.21, against OIES’s base case of $16.05, so traders do not believe it. Gorman warned that October refining margins had come down a little and that Shell could see lower realised numbers this quarter. A hedge cuts both ways, and Kpler expects shipping transit to normalize by mid-2027 — a view about the lanes, not a price forecast.
The kicker
Keep Sawan’s line: “there is now a premium attributed to diverse sources of supply rather than banking on one supply”, and “the integrated strength of Shell will come to the fore in times like this”. The corollary is what Doha has worked out. Integration is not something an exporter can buy at the moment of crisis. It is something you build before one, which is why the country with the largest gas field on earth is shopping in Louisiana.
| STU’S TAKE
Opinion. Every number is linked to its source. This is my opinion, and take it as one. The quarter everyone wants to credit to LNG was a refining quarter. A $42-a-barrel margin against a $28.04 record that had stood since 2022, and $3,855 million out of Chemicals and Products. That is not a trading desk having a good week. That is a physical business earning a scarcity rent because somebody knocked out the alternative. Which is why I keep coming back to refineries. We are not building new ones here, and the ones we shut tend to sit in states that treat a working refinery as a nuisance until the price at the pump becomes a scandal. You cannot import your way out of that on a two-week timetable. Texas learned the lesson from Uri. Most of the country still has not. The part of this that outlasts the quarter is Sawan’s “premium attributed to diverse sources of supply”. He is right, and the proof is that Qatar, which is the supply, is now buying American LNG. Diversity is not a slogan. It is a balance sheet.
|
Appendix
Sources, verbatim excerpts, data tables and methodology notes for “Shell Made $10.8 Billion While Its Qatari Gas Sat Stranded.”
A. Sources (all accessed Oct. 29, 2026 unless stated)
- Shell plc, “Third Quarter 2026 and Nine Months Unaudited Results,” Oct. 29, 2026, 7:00 a.m. GMT (full release, investor-relations host)
- Shell plc, “Shell plc publishes third-quarter 2026 press release,” GlobeNewswire, Oct. 29, 2026, 03:01 ET
- Shell plc, Quarterly Results hub, shell.com/investors, including the third-quarter 2026 update note of Oct. 7, 2026
- CNBC, Jenni Reid, “Shell earnings: oil major posts $10.8 billion profit, lifts buyback,” Oct. 29, 2026, 3:12 a.m. EDT
- Reuters via Investing.com, “Shell beats expectations with $10.8 billion profit, hikes buybacks,” Oct. 29, 2026, 09:14
- Oil & Gas Journal, “Shell’s third-quarter earnings rise on record refining margins, stronger gas results,” Oct. 29, 2026
- The Wall Street Journal, “Shell’s Refining Margin Surges to Record High After Middle East Conflict Upends Fuel Markets,” Oct. 29, 2026 (headline only; article paywalled)
- com, “Earnings call transcript: Shell tops Q3 2026 estimates as shares rise,” Oct. 29, 2026 (AI-generated transcript, reviewed by an editor; see Appendix B2 and D)
- Shell, “Shell’s first quarter 2026 results | Analyst Q&A,” Shell’s official YouTube channel (Q1 2026 call, published April 2026; quotations read from the video’s captions)
- The Oxford Institute for Energy Studies, Bill Farren-Price and Mike Fulwood, “What Next for Hormuz LNG? Alternative Scenarios,” October 2026
- Kpler Insight, “Global LNG & European natural gas winter outlook 2026-27,” webinar deck, Laura Page, Ronald Pinto and Nelson Xiong, Oct. 20, 2026
- Poten & Partners, “Winter Import Growth Threatened by Supply Crunch,” September 2026 LNG Market Outlook, published Sept. 25, 2026
- International Energy Agency, “Global demand for natural gas expected to contract this year as tighter supply pushes up prices,” Gas Market Report Q3-2026, July 7, 2026
- S. Energy Information Administration, “The Strait of Hormuz disruption cut off 20% of global LNG supply,” Today in Energy, Sept. 1, 2026
- European Union Agency for the Cooperation of Energy Regulators, “EU gas storage 75% filled,” Oct. 27, 2026
- ING Think, “The Commodities Feed: European gas tops EUR100 as supply fears grow,” Oct. 29, 2026
- LNGInsights, live LNG price feed carrying LNGPriceIndex assessments, read Oct. 29, 2026 (JKM is an independent estimate, not the Platts assessment)
- JOGMEC via Global LNG Hub, “Natural gas prices weekly update: JKM, TTF and Henry Hub, 19 October 2026,” Oct. 21, 2026
- Bancosta Weekly Report Week 35/2026 via Global LNG Hub, “China LNG imports fall as supply mix shifts,” Sept. 2, 2026
- The Economic Times, “India’s LNG imports surge 9% amid supply gap from Qatar and UAE, with US, Oman and Nigeria leading the charge,” Oct. 22, 2026, citing Kpler data
- The National (Abu Dhabi), “QatarEnergy turns to US LNG with Woodside deal as Hormuz force majeure drags on,” Oct. 29, 2026
- LNG Industry, “QatarEnergy provides production update,” Mar. 20, 2026 (carrying Sheikh Saad al-Kaabi’s statement)
- Euro-Petrole, “Impact of Middle East conflict on Shell activities,” Mar. 20, 2026 (Shell statement)
- com, “Qatari LNG Cargo Heads Through Red Sea to Europe in Rare Suez Run,” Oct. 19, 2026
- Semafor, “Qatar is ramping up liquefied natural gas exports as prices surge,” Oct. 20, 2026 (aggregating Bloomberg vessel tracking)
- Reuters, “More Qatari LNG cargoes transit Strait of Hormuz despite ongoing risks,” Oct. 5, 2026 (paywalled; used only for the vessel movements corroborated elsewhere)
- Reuters, “Shell, TotalEnergies, others declare force majeure to clients who take LNG from Qatar,” Mar. 11, 2026 (paywalled; corroborated by The National, July 30, 2026)
- RBN Energy, “US LNG Feedgas Sticks at Record Levels,” Oct. 27, 2026
- European Commission, Gas Storage policy page, energy.ec.europa.eu
- European Commission, “Gas Coordination Group confirms readiness to prepare the upcoming winter season,” Mar. 26, 2026
- iMarine, report on QatarEnergy charter deferrals, carrying TradeWinds reporting (paywalled at source; single-sourced, dated early 2026, status unconfirmed at publication)
B. Key primary-document excerpts, verbatim
B1. Shell’s own release, on Integrated Gas trading
These are the three sentences the article turns on. The first two are the year-on-year and quarter-on-quarter driver explanations. The third is the caveat that most coverage skipped, and it is why the piece says the trading surge is a nine-month fact rather than a three-month one.
“Adjusted Earnings, compared with the second quarter 2026, reflected higher volumes (increase of $360 million) and the combined net effect of realised prices and contributions from trading and optimisation (increase of $324 million), partly offset by higher operating expenses (increase of $180 million).” Link
“Adjusted Earnings, compared with the first nine months 2025, reflected the combined effect of higher contributions from trading and optimisation and higher realised prices (increase of $3,783 million), partly offset by lower volumes (decrease of $1,279 million), unfavourable tax movements ($583 million) and higher operating expenses (increase of $508 million).” Link
“Adjusted Earnings were higher than in Q2 2026, reflecting higher gas and LNG prices. Trading and Optimisation was in line with Q2 2026.” (from Shell’s Q3 2026 press release, Integrated Gas section — not the unaudited results document) Link
“Adjusted Earnings, compared with the second quarter 2026, reflected higher Refining margins, higher realised LNG prices and higher Integrated Gas volumes. These were partly offset by lower crude and oil products trading and optimisation, higher well write-offs and lower realised liquids prices.” (group driver list) Link
“higher Products margins (increase of $1,065 million), mainly driven by higher Refining margins, partly offset by lower trading and optimisation” (Chemicals & Products) Link
B2. The Q3 2026 earnings call: the question the article turns on
Read the transcript caveat before quoting any of this. The page these lines come from carries an explicit disclosure: “This article was generated with the support of AI and reviewed by an editor.” The quotations are treated here as probable rather than certified, they are attributed in the body to “the Q3 earnings call” rather than presented as a verbatim official record, and Shell’s own published CFO remarks should be checked against them before print. The substance, not the punctuation, is what the article relies on.
Matt Lofting, JPMorgan: “3Q was another very strong quarter for Integrated Gas, despite the impact on Shell’s Qatari assets. In the macro conditions of recent months, are you effectively experiencing a degree of natural business hedge insofar as disruption and lost volumes in the Middle East ends up directly contributing to greater market-wide price dislocations and volatility, which the rest of Shell’s business is ideally positioned to monetize?” Link
Sinead Gorman, CFO: “we continue to see with what is happening in the Strait, the impact on particularly our Integrated Gas business at the moment. So in terms of both on Pearl and the inability to be able to get product out, but also on some of the LNG there as well, which will play into Q4 as well. So that is not something that is just going away at any point in time.” Link
Gorman on freight: “just that route between anywhere in the Middle East and China at the moment is 10 times what it was from even just 12 months ago.” Her three-part frame was access to vessels, the cost of freight, and the ability to trade around freight: “number one and number three, it’s certainly been helping us.” Link
Gorman on the refining margin into the fourth quarter: October “we saw it come down a little bit relative to where it was for Q3. We do believe we could see lower realized numbers coming through this quarter, given the freight rates.” Link
Gorman on the buyback band: 40-50% of cash flow from operations is “sacrosanct… through the cycle,” with Shell near the bottom of that band at a cycle high. Link
B3. Al-Kaabi on the damage and the force majeure
“The damage sustained by the LNG facilities will take between 3 – 5 years to repair. The impact is on China, South Korea, Italy, and Belgium. This means that we will be compelled to declare force majeure for up to five years on some long-term LNG contracts.” Link
Trains 4 and 6 were destroyed: 12.8 Mtpa, about 17% of Qatar’s export capacity. Pearl GTL was struck as well, with one of its two trains offline “a minimum of one year.” Link
On the restart condition for undamaged facilities: they could come back “within a week of a peace deal if ships were available.” He has ruled out Hormuz-bypass pipelines. Link
Force majeure was extended for several buyers through the end of December 2026. Link
B4. OIES on the scale of the loss, and on why duration beats severity
“Ongoing security risks to commercial shipping in the Strait of Hormuz since the US and Israel launched their war on Iran in late February have kept around 80 per cent of the previously available LNG, from the two Gulf producers Qatar and the UAE, sidelined.” Link
“In the five years from March 2021 to February 2026, combined exports from Qatar and UAE averaged 9,374 MMcm per month. Between 1 March and 30 September 2026, those exports averaged 1,733 MMcm per month. The 7,641 MMcm per month reduction… equates to 81.5 per cent of the pre-crisis five-year average.” (Kpler data, subscription) Link
“duration and timing are more important than the outright scale of the initial supply shock… Ultimately, the difference between an LNG supply disruption that ends in months and one that persists matters far more than its initial severity: prices may spike similarly at first, but only a lasting disruption keeps them elevated into 2028.” Link
“the modelling shows that high prices balance the market mostly by driving down demand rather than generating additional supply, which remains constrained in the short run.” Link
“both the most supply restrictive scenarios… see prices peak only $3-4/MMBtu above prompt levels… which suggests that the bulk of the upside impact for restrictive scenarios is already priced in.” Link
“As in 2022, South Asia loses imported gas it can no longer afford, while North Asian importers are largely insulated from the supply loss, as they are able to afford higher-priced LNG.” Link
“Supply flexibility is limited by high liquefaction utilization rates that have regularly exceeded nameplate capacity in the US in 2026.” And: “US exports are essentially unchanged in 2027, consistent with US plants already running at capacity.” Link
“As of 16 October, Q1-2027 TTF futures are close to prompt prices at EUR 85.95/MWh ($28.21/MMBtu) falling to EUR 68.84/MWh ($22.60/MMBtu) in Q2-2027 – compared to the modelled base case of $16.05/MMBtu for Q1-2027… implying that for now, the market has little idea of what might happen.” Link
B5. The India shift, with the named analyst
“The shift demonstrates India’s ability to secure alternative supply, although maintaining import volumes has required greater exposure to flexible international LNG markets and elevated prices.” Sonal Ranjan, Kpler, via The Economic Times. Link
India’s LNG imports rose 9% between March and September 2026. Qatar’s share of Indian imports fell from 45% to 3%. The United States, Oman and Nigeria went from 25% to 68%. The UAE fell from 14% to 8%. Link
More than a third of India’s LNG is now spot, at a JKM near $30 against an average of $20 from March to September, itself up from $12 a year earlier. Long-term oil-indexed contracts would cost about $14/MMBtu at $110 Brent. Demand is held up by fertiliser, which is price-insensitive and subsidised, with gas being cut from ceramics, glass and refining. Link
B6. Sawan on Pearl, on storage, and on “just in case”
On Pearl GTL: “we have partially restarted one of the trains. Do not expect much in terms of cash flow or earnings at this stage. We are filling up the inventory there.” The second train is “still planned for late in Q1,” “subject to the Strait of Hormuz opening and our ability to evacuate product.” Link
Shell built what Sawan called “essentially a land bridge across multiple countries” to move base oil to its lubricants business. Link
On the strategic read-across: “there is now a premium attributed to diverse sources of supply rather than banking on one supply.” Storage has shifted “from just in time to just in case.” And: “The integrated strength of Shell will come to the fore in times like this.” Link
B7. Shell’s Q1 2026 analyst Q&A, which is a different call
The article uses two lines from Shell’s own published video of its first-quarter 2026 analyst Q&A. This is not the third-quarter call and should not be read as though it were: it is an earlier call, dated to the first quarter, and it is cited because Shell published it itself, which makes it firmer ground than an AI-generated transcript. The lines were read from the video’s captions, so treat them as accurate in substance rather than as a checked-and-certified transcript. The first line is the cleanest statement of the portfolio-substitution mechanism anywhere in the record, in the CEO’s own words.
Wael Sawan, CEO: “LNG Canada stepped up when the Qatari volumes were out.” Link
Wael Sawan, CEO: “what you will see is that price lag effect play into the second quarter for IG results because of the term contract nature of that pricing.” Link
The second line is the useful one for the accounting. Integrated Gas pricing carries a lag because a large share of the portfolio is sold on term contracts rather than at spot, which is consistent with the article’s reading of the third quarter: the segment moved on prices and volumes, and the year-on-year trading contribution built up over nine months rather than arriving in a single three-month window.
C. Data tables
C1. Shell, third quarter 2026, with both comparatives
| $ million unless stated | Q3 2026 | Q2 2026 | Q3 2025 | Source |
| Income attributable to shareholders | 12,057 | 10,821 | 5,322 | Shell |
| Adjusted Earnings | 10,814 | 9,836 | 5,432 | Shell |
| Adjusted EBITDA | 22,736 | 20,710 | 14,773 | Shell |
| Cash flow from operations | 21,043 | 21,432 | 12,207 | Shell |
| Free cash flow | 16,322 | 17,524 | 9,950 | Shell |
| Cash capex | 7,922 | 4,237 | 4,907 | Shell |
| Net debt | 39,733 | 41,754 | 41,204 | Shell |
| Gearing | 16.6% | 18.7% | 18.8% | Shell |
| ROACE | 14.4% | 12.4% | 9.4% | Shell |
| Production available for sale (kboe/d) | 2,574 | 2,455 | 2,821 | Shell |
| Dividend per share ($) | 0.3906 | 0.3906 | 0.3580 | Shell |
| Basic EPS ($) | 2.15 | 1.94 | 0.91 | Shell |
| Adjusted EPS ($) | 1.93 | 1.76 | 0.93 | Shell |
| Revenue | 92,848 | 94,664 | 68,153 | Shell |
| LNG liquefaction (Mt) | 7.43 | 7.73 | 7.29 | Shell |
| LNG sales volumes (Mt) | 19.25 | 17.96 | 18.88 | Shell |
| Global indicative refining margin ($/bbl) | 42 | 24 | — | Shell update note, CNBC |
The $28.04 record for a quarter is from the second quarter of 2022, and the $42 print was pre-announced in Shell’s Oct. 7 update note rather than disclosed for the first time with the results. That distinction matters if you are writing about what surprised the market: the margin did not.
C2. Adjusted Earnings by segment, with both comparatives
| Segment | Q3 2026 | Q2 2026 | Q3 2025 | QoQ | YoY |
| Integrated Gas | 3,037 | 2,691 | 2,143 | +13% | +42% |
| Upstream | 3,189 | 3,485 | 1,804 | −8% | +77% |
| Marketing | 1,164 | 1,329 | 1,316 | −12% | −12% |
| Chemicals & Products | 3,855 | 2,877 | 550 | +34% | +601% |
| of which Chemicals | 103 | — | — | — | — |
| of which Products | 3,751 | — | — | — | — |
| Renewables & Energy Solutions | 289 | 79 | 92 | +266% | +214% |
| Corporate | (705) | (617) | (383) | — | — |
| Total including non-controlling interests | 10,828 | 9,845 | 5,523 | — | — |
| Less non-controlling interests | 14 | 9 | 91 | — | — |
| Attributable to shareholders | 10,814 | 9,836 | 5,432 | — | — |
Source for the table: Shell, Note 2 “Segment information,” Oct. 29, 2026 (link). Chemicals & Products at $3,855 million is 36% of the $10,814 million attributable figure, and that percentage appears in the body because it is the cleanest way to say that a refining business, not an LNG business, carried the quarter. Marketing is the only segment down year on year. Its 12% fall in Adjusted Earnings came from weaker Mobility unit margins and lower Lubricants volumes, not from the $1,904 million impairment: that charge is an identified item, and Adjusted Earnings excludes identified items, so the two sit on opposite sides of the line. What the charge did do is drive Marketing’s reported income down to $55 million, from $1,747 million in Q2 2026 and $576 million in Q3 2025, which is the sharper number and a different one.
C3. LNG and gas prices on Oct. 29, 2026, each in its own unit
| Benchmark | Level | Change | Unit | Source and timestamp |
| JKM (indicative estimate) | $33.26 | −2.18% | $/MMBtu | LNGInsights feed, read 1:00 p.m. CT |
| TTF front month | €97.51 | −2.27% | €/MWh | LNGInsights feed, read 1:00 p.m. CT |
| TTF, dollar equivalent | about $31.92 | — | $/MMBtu | Publisher’s own conversion, same read |
| NBP | 236.34p | −2.26% | pence/therm | LNGInsights feed, same read |
| Henry Hub | $2.95 | −2.16% | $/MMBtu | LNGInsights feed, same read |
| JKM over TTF | +$1.34 | — | $/MMBtu | Publisher’s own spread, same read |
| JKM over Henry Hub | +$30.31 | — | $/MMBtu | Publisher’s own spread, same read |
| TTF, Oct. 28 crossing | above €100 | +4.85% | €/MWh | ING, Oct. 29, 2026, on the prior session |
| JKM, Oct. 16 (December delivery) | high $29s | — | $/MMBtu | JOGMEC via Global LNG Hub, Oct. 21, 2026 |
| TTF, Oct. 16 | $28.9 | — | $/MMBtu | JOGMEC, same |
| Henry Hub, Oct. 16 | $3.1 | — | $/MMBtu | JOGMEC, same |
The JKM figure is an independent estimate published by LNGPriceIndex and carried by LNGInsights, not the Platts assessment, and the article labels it that way every time it appears. TTF is a futures contract and can be checked against ICE directly. The dollar equivalent in the third row is the publisher’s own conversion and is not recomputed here, which is why the article does not present a second or third decimal place for it.
C4. The two forces on winter supply, and why they are shown apart
| Component | Change | Level | Source |
| Kpler: last winter, 2025-26 | — | 229.1 Mt | Kpler |
| Kpler: new supply added | +17.5 Mt | — | Kpler |
| Kpler: supply lost, all causes | −21.0 Mt | — | Kpler |
| of which Qatar / Hormuz | −18.1 Mt | — | Kpler |
| Kpler: this winter, 2026-27 | −3.5 Mt net | 225.6 Mt | Kpler |
| Poten: last winter, 2025-26 | — | 231.5 Mt | Poten |
| Poten: this winter, 2026-27 | −6 Mt net | 225.6 Mt | Poten |
Both houses land on 225.6 Mt for the coming winter, and they get there from different starting points: Kpler measures its −3.5 Mt against a 229.1 Mt baseline, and Poten measures −6 Mt against 231.5 Mt. Kpler’s bridge closes exactly on its own base: 229.1 Mt, plus 17.5 Mt of new supply, less 21.0 Mt of losses (18.1 Mt of that Qatar), equals 225.6 Mt. Poten’s figures are rounded in its own headline — −6 Mt to 225.6 Mt from 231.5 Mt, where the subtraction gives 225.5 — which is normal for a published summary and not a discrepancy worth chasing. What does not work is mixing the two: applying Kpler’s components to Poten’s 231.5 Mt lands at 228.0 Mt, some 2.4 Mt above the level both houses publish. Chart 3 therefore plots one house’s complete, internally consistent bridge rather than a hybrid of both. The number this article leans on is the level both houses independently publish, 225.6 Mt, which is the cross-check that matters: two different methods, two different bases, one answer.
C5. The share-price move: two listings, two clocks, no closing price
| Claim | Figure | What it measures | Source |
| “Shares rose 3% to an all-time high” | up around 3% in morning trade | The LONDON-listed line, morning trade | CNBC, Oct. 29, 2026 |
| “+2.54% to $107.86” | from a $105.19 prior close | The NYSE ADR (SHEL), pre-market | Investing.com, Oct. 29, 2026, 12:10 p.m. |
| ADR, Oct. 28 close | $105.19 | The ADR’s last settled price | ADR history, Oct. 29, 2026 |
| ADR, Oct. 29 intraday | $107.82 to $108.14, up about 2.5% to 2.8% | Intraday, market still open | ADR history, read 12:44 p.m. EDT |
| ADR 52-week high | $108.43, set Oct. 23, 2026 | Trailing year | ADR history, same |
The two published claims are not in conflict once you separate the listings. CNBC’s own copy places the 3% gain on “Shell’s London-listed shares” in morning trade, and that line did print an all-time high. Investing.com’s 2.54% to $107.86 is the New York ADR, measured against its $105.19 close the day before. The ADR did not reach an all-time high: its 52-week high of $108.43 was set on Oct. 23, 2026, and on Oct. 29 it traded at roughly $107.8 to $108.1. Nor is either figure a closing price. The U.S. session was still open when this was written, so the only honest statement about the ADR is that it was up around 2.5% to 2.8% intraday. Because the ADR and the London ordinary shares are different instruments trading on different clocks, no single percentage reconciles them, and this article therefore carries no share-price number. Anyone updating the piece after the U.S. close should use the settled ADR close and the London close separately, not a blended figure.
D. Background and methodology
Why Qatar matters to the LNG balance. Before the war, the Strait of Hormuz carried roughly 20% of the world’s LNG, almost all of it from Qatar and the UAE, and roughly 80% of Qatari cargoes went to Asia. Take that volume out and there is no spare liquefaction anywhere that can absorb it: US plants are running at or above nameplate, Australia is committed, and the projects meant to add supply in 2027 have been pushed back. That is why a disruption of a single exporter moved a global price rather than a regional one, and why the second-order effects show up in fertiliser and freight rather than only in gas bills.
What force majeure actually means for a buyer. A force majeure clause lets a seller suspend deliveries without liability when an event outside its control prevents performance. The buyer is not compensated for the lost cargo; it must replace the volume in the spot market, at whatever the spot market is charging, and it usually keeps paying for the contract it is not receiving. That is the mechanism that transferred value this year: buyers who had locked in Qatari supply at term prices were pushed into a spot market near $30, and the sellers who had kept destination and timing flexibility were the ones able to serve them. Al-Kaabi’s warning of force majeure “for up to five years on some long-term LNG contracts” is unusually long for the industry, and it is the single clearest signal that this is not a shipping delay.
FOB, DES, and why the contract form decided who got paid. Under free on board, the buyer takes title at the loading port and chooses the destination, so the buyer captures any diversion value. Under delivered ex-ship with a fixed destination, the seller must deliver to one named port, and if that port is unreachable the contract is force majeure and nobody earns anything. Flexible delivered contracts sit between the two, with destination ranges and diversion rights that are usually shared. A disruption does not create value from nothing; it moves it from the parties who fixed their destinations to the parties who kept their options. Shell’s portfolio is deliberately built out of options, and that is the whole explanation for how a company can lose its own supply and still earn more.
Units, and what was converted. Gas prices here are quoted in the unit each market publishes: TTF in euros per megawatt-hour, Henry Hub and JKM in dollars per million British thermal units, NBP in pence per therm. One megawatt-hour equals about 3.412 MMBtu, which is a definitional constant rather than an estimate, and the only dollar figure for TTF in this article is the publisher’s own conversion, not one performed here. Volumes are in million tonnes of LNG and, where Shell reports them, in thousand barrels of oil equivalent a day. No tonne-to-thermal conversion appears anywhere in the piece, and no figure is presented in a unit its publisher did not use.
The two houses that agree. Kpler and Poten reach 225.6 Mt for winter supply from different models and different baselines. That agreement is worth more than either forecast on its own, which is why the article cites the level and names both. It is also why Appendix C4 prints the two net-change figures side by side instead of picking one: they are both published, they are measured against different base years, and a reader who tries to add them up deserves to be told why the arithmetic does not close.
The United States as the swing supplier that has already swung. US LNG feedgas averaged 20 Bcf/d in the week to Oct. 25, first reached that level on Oct. 16, and all terminals were at full or peak rates (RBN). OIES makes the strategic point that matters: liquefaction utilisation has regularly exceeded nameplate in 2026, and US exports are “essentially unchanged in 2027.” A supplier running flat out cannot respond to a new crisis, which is precisely why QatarEnergy is signing 20-year deals rather than waiting for the spot market to clear.
EU storage, stated carefully. Storage stood at 75% on Oct. 21 (ACER), against a 90% target that for 2026 must be met at any point between Oct. 1 and Dec. 1 rather than by Nov. 1, and member states may deviate by up to ten percentage points in difficult market conditions. In March the Commission explicitly invited countries to use that flexibility and to consider an 80% level early in the filling season (Commission, storage policy). Europe will most likely miss the headline number. Saying only that would be misleading, and saying the target was really 80% would be wrong. Both halves belong in the same sentence, which is why the article carries them together.
The IEA edition. The current Gas Market Report is Q3-2026, published July 7, 2026 (IEA). The Q4 edition, published with the Global Gas Security Review, is due Nov. 3, 2026, five days after this article. Every IEA reference here is to the Q3 edition, and the agency is quoted conditionally throughout. Its wording is that if a full reopening of the Strait of Hormuz is delayed beyond the beginning of the fourth quarter, that could trigger the first annual decline in global LNG supply since 2012. The first half of that condition has now come to pass, because the strait was still not fully reopened when the quarter began. The agency also forecasts, in the same release, that supply for the full year 2026 is largely unchanged from 2025, because other producers are adding output. The winter decline described in this article is the Kpler and Poten call, not the IEA’s, and is reported as such.
What could not be verified, and what was therefore softened or left out.
- The earnings-call quotations come from an AI-generated transcript that discloses its own use of AI. They are attributed to “the Q3 earnings call” in the body, never presented as a certified verbatim record, and Shell’s official CFO transcript should be checked before this piece goes up. If any wording differs, the substance of the exchange is unlikely to change but the quotation marks would have to.
- The two lines from Shell’s Q1 2026 analyst Q&A were read from the captions of Shell’s own published video. They are accurate in substance and not a certified transcript, and the Q1 call is dated as the first quarter everywhere it appears so that no reader confuses it with the third-quarter call.
- Shell’s offtake from QatarEnergy LNG is widely reported at about 6.8 Mtpa and is not in any Shell primary document this desk could open. The 30% stake in QatarEnergy LNG N(4), equal to 2.4 Mtpa of equity production, is primary and comes from Shell’s own statement of Mar. 20, 2026. The article uses the equity stake and does not use the offtake volume.
- TradeWinds reported that QatarEnergy has invoked an Indefinite Delay Option on long-term charter deliveries and sought to charter out ten idle carriers. The story is paywalled, single-sourced, dated earlier in 2026, and its status as of late October could not be confirmed. It is referenced here only as a source, and no version of it appears in the body.
- The share-price move. The two published figures describe different listings, not different versions of one fact: CNBC’s 3% is the London line in morning trade, Investing.com’s 2.54% is the New York ADR in pre-market. Neither is a close, and the ADR never cleared its Oct. 23 high of $108.43. Reconstructed in Appendix C5; no percentage appears in the article.
- Golden Pass Train 2 and Train 3 timing rests on trade press. One account has Train 2 feedgas from November 2026; another has full operation of Trains 2 and 3 in 2027. The article uses only the part that is not in dispute, which is that QatarEnergy owns 70% of Golden Pass and that the first train is exporting.
- The ~$6.8 Mtpa figure above and the phrase “reported” are the only places this article touches on the offtake question at all, and neither appears in reader-facing body copy.
A final note on the official record. Shell publishes an official transcript of its CFO’s prepared remarks and, separately, an analyst Q&A recording. Neither had been checked line by line against the quotations in this piece at the time of writing. The release language in B1 is taken directly from Shell’s own results document and is the most solid ground in the article; the call material in B2 and B6 is one grade below that and is labeled accordingly.
The post Shell Made $10.8 Billion While Its Qatari Gas Sat Stranded appeared first on Energy News Beat.