
California’s aggressive pursuit of Net Zero and 100% clean electricity has produced record solar milestones, massive battery buildouts, and political talking points about climate leadership. It has also delivered some of the nation’s highest electricity prices, chronic reliability problems, heavy reliance on out-of-state imports, and a grid vulnerable to regional shortfalls and global energy shocks. Residents are paying the price in higher bills and more frequent darkness.
A recent Orange County Register analysis by Susan Shelley lays out the core problem clearly: California’s green energy “fantasy” prioritizes intermittent renewables over dispatchable power, leaving the state dependent on imports and exposed when the sun sets, the wind dies, or transmission lines fail. On the night of August 8, 2026, CAISO data showed natural gas still providing nearly 45% of supply during evening demand, with batteries depleted and imports filling gaps. Claims of solar dominance often exclude imports and focus on sunny spring months rather than year-round, night-time, or extreme-weather needs.
Overreaching Net Zero Policies and Import Dependence
California’s core mandates—Senate Bill 100 (100% renewable and zero-carbon electricity by 2045, with interim targets of 60% by 2030 and higher percentages thereafter), plus related electrification rules for vehicles, buildings, and appliances—have driven rapid solar and wind deployment while pressuring natural gas and nuclear plants. Diablo Canyon’s life was extended only after reliability fears forced a rethink. The result is a grid heavy on weather-dependent resources that require extensive transmission from remote areas and substantial imports.
In 2024, net electricity imports totaled about 62,157 GWh—roughly 22% of California’s total system supply of 278,338 GWh, according to the California Energy Commission. The state is routinely one of the largest (or the largest) electricity importers in the U.S., drawing from the Northwest (hydro/wind) and Southwest. Imports often rise in the evening when solar fades. This dependence exposes California to conditions outside its control: heat waves that strain neighboring grids, wildfires that knock out transmission (as in the 2021 Bootleg Fire), droughts affecting hydro, or broader Western energy constraints.
A California Energy Commission security plan has explicitly flagged heavy reliance on imported electricity (around 20–30%), natural gas, and petroleum as creating supply risks.
When global or regional energy markets tighten—whether from geopolitical events, extreme weather elsewhere, or competing demand—California’s import reliance turns local policy into a vulnerability.
Batteries have grown dramatically (exceeding 21,000 MW by mid-2026), helping shift daytime solar to evenings, and clean resources have met high shares of demand for portions of many days. Yet intermittency remains: batteries discharge and need recharging; multi-day heat or calm periods still stress the system. Officials project sufficient resources for a “normal” 2026 summer with surplus capacity under standard planning, but they acknowledge risks from overlapping extremes and continue to rely on emergency reserves and imports.
Sky-High Prices and Comparison to the Most Expensive States
California’s residential electricity rate stood at 33.25 ¢/kWh as of May 2026 EIA data—about 80% above the U.S. average of 18.44 ¢/kWh. Commercial rates are also elevated. Rate increases from 2014–2026 far outpaced inflation: PG&E up ~69%, San Diego Gas & Electric ~97%, Southern California Edison ~101%.
Drivers include renewable procurement mandates, grid hardening against wildfires, recovery of wildfire costs, transmission for remote renewables, net metering cost shifts, and utility overhead. Over 20% of utility customers were behind on bills as of mid-2026.
Here is how California ranks among the top five most expensive states for residential electricity (May 2026 EIA data):
- Hawaii: 52.00 ¢/kWh (isolated grid, heavy oil dependence)
- California: 33.25 ¢/kWh
- New York: 29.93 ¢/kWh
- Rhode Island: 29.46 ¢/kWh
Massachusetts: 28.82 ¢/kWh
California is the most expensive contiguous state by a clear margin. Lower-cost states often benefit from abundant hydro, natural gas, or competitive markets without the same combination of aggressive mandates, wildfire-driven costs, and transmission requirements.
What This Means for Consumers—and Should They Prepare for More Blackouts and Higher Prices?
For households and businesses, the combination means persistently higher monthly costs, greater risk of service interruptions, and limited short-term relief. California led the nation in major power outages from 2003–2023 (493 events affecting tens of millions of people, averaging over 40 hours each), with physical attacks/vandalism, weather, equipment failure, fires, and intentional Public Safety Power Shutoffs among the causes. Recent years have seen frequent events, including intentional shut-offs and fast-trip settings that hit rural areas hard.
Official summer assessments for 2026 are more optimistic than the crisis years of 2020–2022 thanks to new solar, wind, and especially batteries. No Flex Alerts were needed in recent milder summers.
Still, peak demand is rising with electrification and data centers, and extreme heat coinciding with transmission limits or low renewable output remains a risk. Policies continue to emphasize more renewables and storage rather than a rapid return to firm, dispatchable capacity. Rate pressures from infrastructure, wildfire mitigation, and procurement are not disappearing overnight.
Consumers should prepare for the possibility of continued elevated prices and intermittent outages in the near term. Practical steps include maintaining emergency supplies (water, non-perishable food, flashlights, charged power banks, medical device backups), considering home batteries or generators where feasible and permitted, monitoring utility alerts for Public Safety Power Shutoffs, and exploring energy efficiency or demand-response programs that may offer bill credits.
Long-term structural change—rebalancing the resource mix toward more firm power while pursuing emissions reductions—would require policy shifts that are not currently dominant in Sacramento.
California’s experiment demonstrates that rapid decarbonization without adequate firm capacity, transmission resilience, and cost discipline produces real hardships for residents. The state’s roughly 1% share of global greenhouse gas emissions means local sacrifice does not meaningfully alter planetary outcomes, yet the local price in affordability and reliability is high.
Green aspirations have collided with the physics and economics of keeping the lights on. Until the approach prioritizes reliability and cost alongside emissions targets, residents will continue to live with the consequences.
Is Texas perfect? No, but if Texas is not careful, it will follow California into fiscal decline.
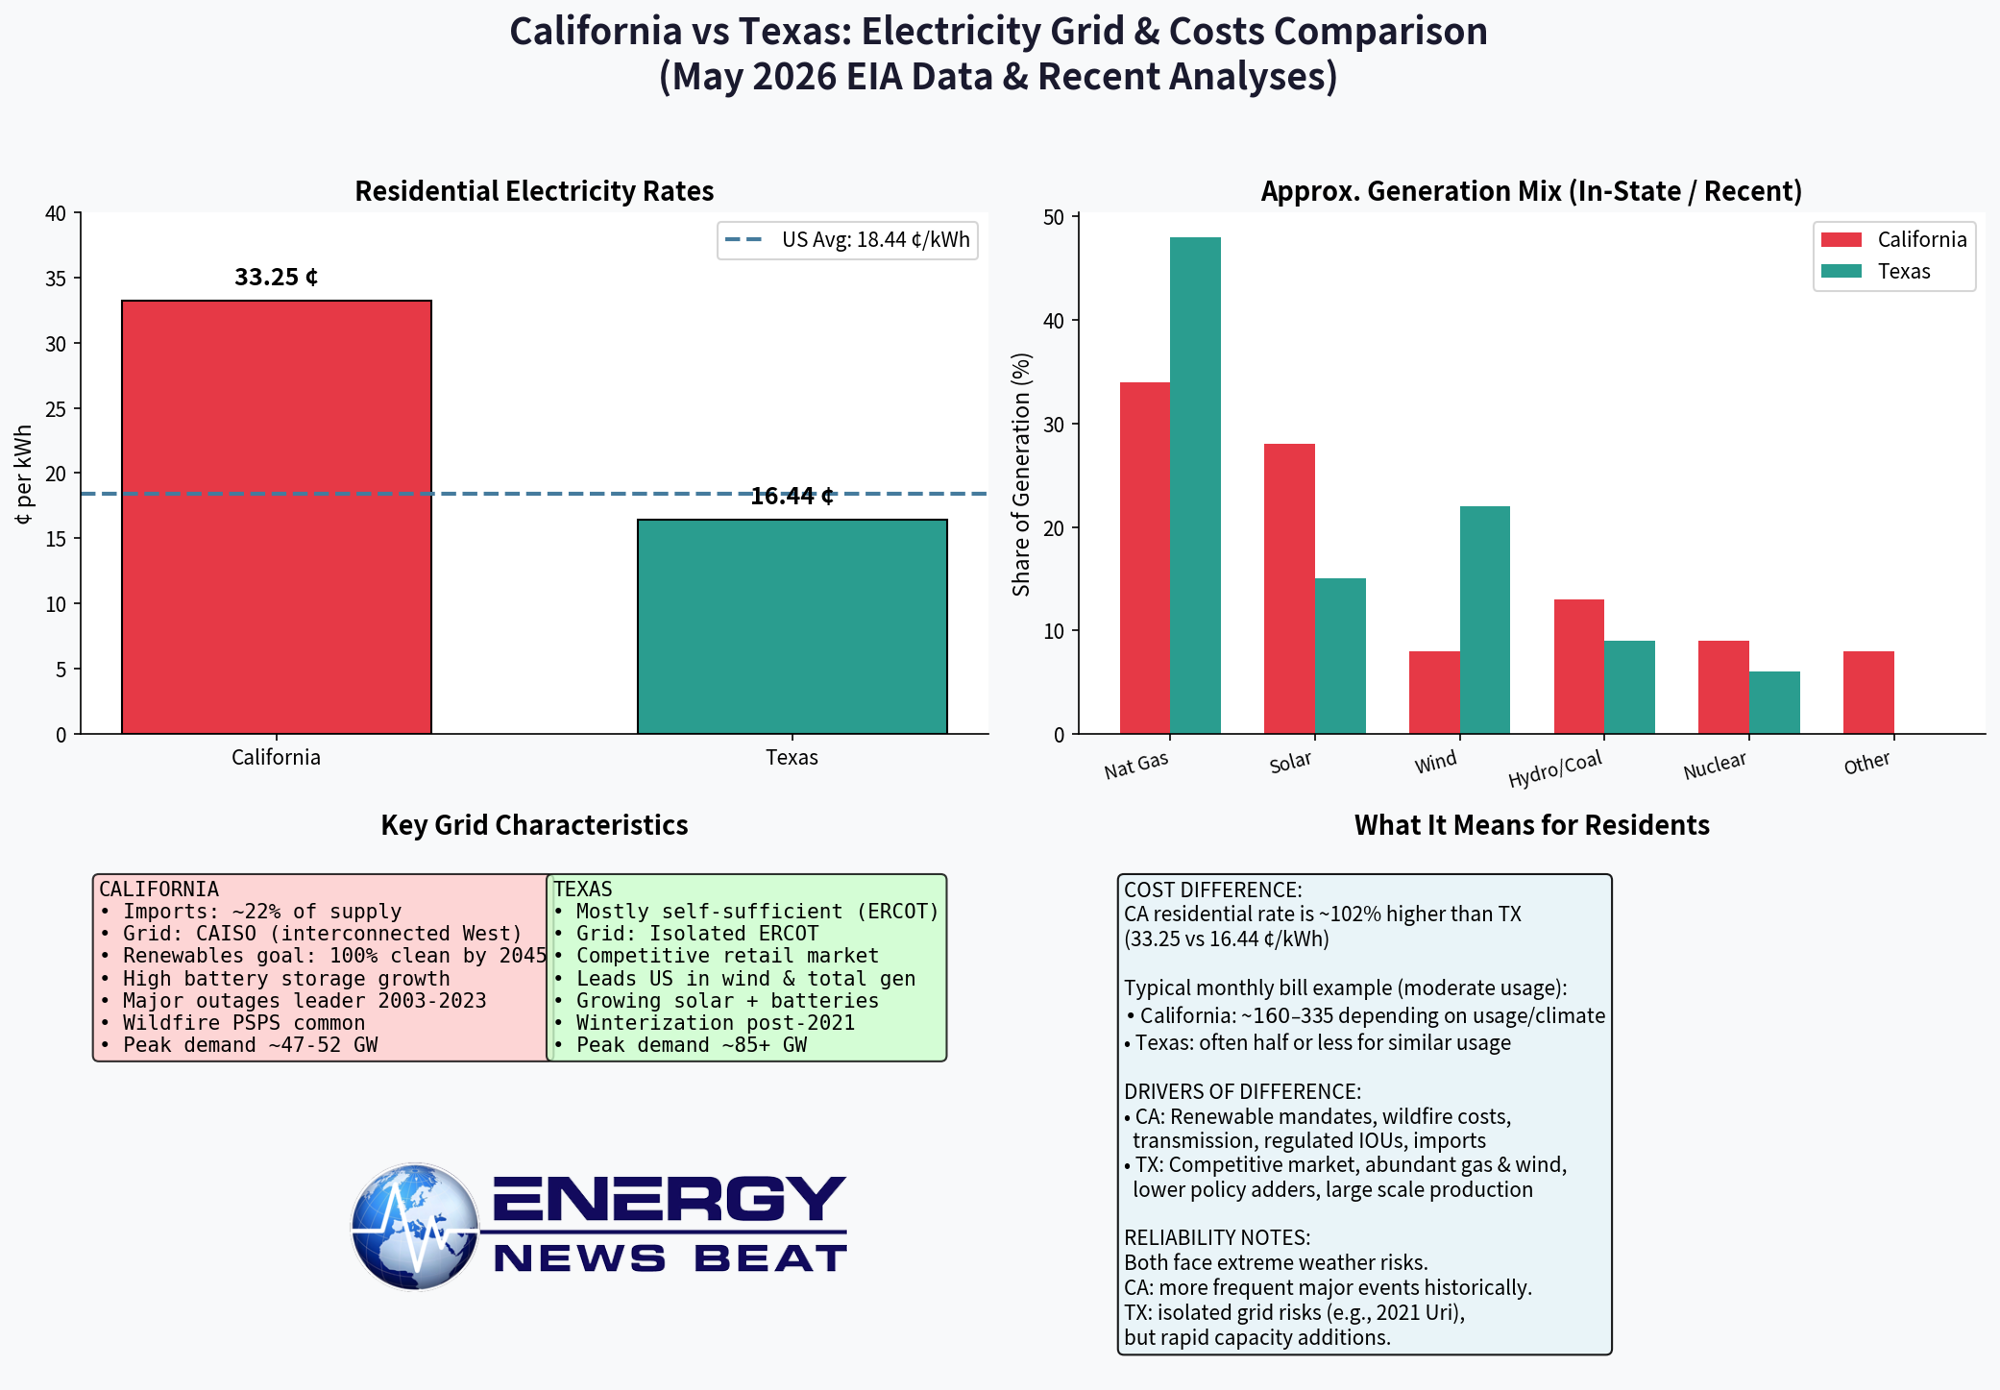
Key Takeaways from the Comparison
Residential Electricity Rates (May 2026 EIA) California: 33.25 ¢/kWh
Texas: 16.44 ¢/kWh
U.S. Average: 18.44 ¢/kWh
California’s rate is roughly double Texas’s (about 102% higher). Generation Mix (approximate recent in-state shares)
- California: Natural gas still dominant (~34%), strong solar (~28% utility-scale + significant rooftop), hydro, nuclear, wind. Heavy reliance on imports (~22%).
- Texas: Natural gas (~48%), strong wind (~22%), growing solar, coal, nuclear. Largely self-sufficient within the ERCOT grid.
Grid Structure
- California (CAISO): Interconnected with the Western grid → can import/export, but vulnerable to regional shortfalls, wildfires, and transmission limits. Aggressive 100% clean-by-2045 mandates.
- Texas (ERCOT): Isolated grid → limited ability to import during crises, but competitive retail market and rapid buildout of wind, solar, and gas keep costs lower and scale larger (Texas is the top U.S. electricity producer).
Reliability Context:
- California historically leads the nation in major power outages (2003–2023 data). Public Safety Power Shutoffs for wildfire risk are common.
- Texas experienced severe issues in Winter Storm Uri (2021) due to its isolation, but has since added significant capacity and improved winterization. Both states face extreme-weather pressure as demand grows.
Bottom line for consumers
Californians pay substantially more for electricity, partly due to renewable mandates, wildfire mitigation, transmission costs, and import dependence.
Texans benefit from a competitive market, abundant natural gas and wind resources, and economies of scale. Sources underlying the numbers include EIA Electric Power Monthly (May 2026 data), California Energy Commission generation reports, ERCOT resource data, and state-level analyses of outages and capacity. Rates and mixes can vary slightly by month, utility, and exact methodology (e.g., including vs. excluding rooftop solar or imports).
Who you vote for matters. Friends don’t let Friends vote for Democrats or Rinos – just saying.
Appendix: Sources and Links
- Susan Shelley, “California’s green energy fantasy is leaving residents in the dark,” Orange County Register, August 8, 2026: https://www.ocregister.com/2026/08/08/californias-green-energy-fantasy-is-leaving-residents-in-the-dark/
- California Energy Commission, 2024 Total System Electric Generation: https://www.energy.ca.gov/data-reports/energy-almanac/california-electricity-data/2024-total-system-electric-generation
- U.S. Energy Information Administration, Electric Power Monthly (Table 5.6.A, May 2026 data): https://eia.gov/electricity/monthly/epm_table_grapher.php?t=epmt_5_6_a
- EnergyBot / multiple aggregators of EIA rates (California 33.25 ¢/kWh residential, state rankings): https://www.energybot.com/electricity-rates/california/ and https://costtorunit.com/electricity-rates-by-state
- TexasElectricityRatings.com analysis of DOE OE-417 outage data (2003–2023): referenced in KTLA and related coverage, https://ktla.com/news/california/data-shows-california-leads-the-nation-in-power-outages/
- California ISO supply data and summer assessments: https://www.caiso.com/
- Public Advocates Office, California Public Utilities Commission reports on rates and customer arrears
- Additional context on imports, security risks, and battery growth from CEC Energy Security Plan summaries, GridLab analyses, and official announcements (e.g., battery capacity exceeding 21,000 MW)
- Comparative rate tables and bill data from ElectricChoice, ElectricityPlans, and related EIA-derived sources
Data primarily reflect the most recent available EIA and state figures as of mid-2026. Policy and grid conditions continue to evolve.
The post California’s green dreams are turning into a dark nightmare for residents.- And how Does Texas Compare? appeared first on Energy News Beat.