
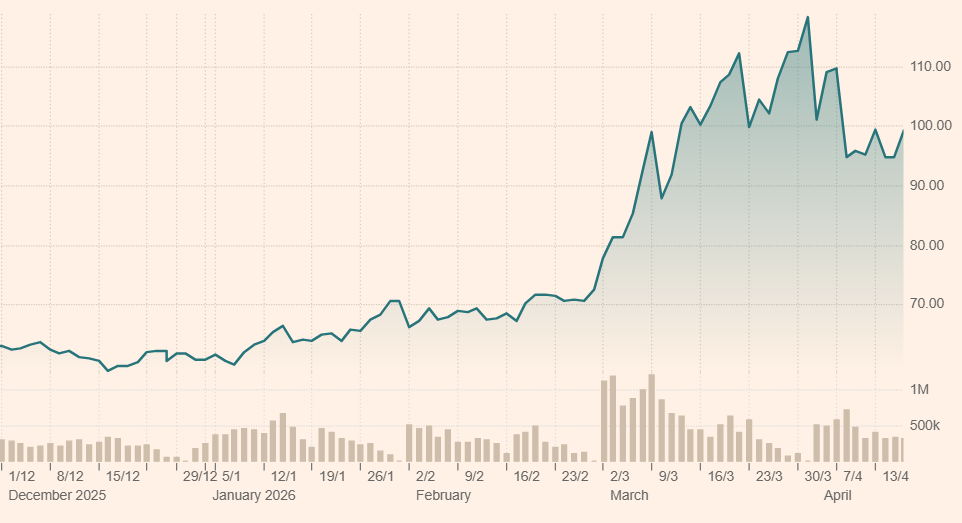
In the high-stakes world of global energy markets, two prices for oil exist side by side — but they are telling wildly different stories right now. The “paper” price, reflected in Brent and WTI futures contracts traded on exchanges, sits around $99 per barrel as of April 22, 2026. Meanwhile, the physical price for delivered barrels — what refiners and buyers pay for real crude in the spot market — has hit record highs, exceeding $144 per barrel in recent weeks.
This massive disconnect isn’t just academic. It signals a profound supply shock in the physical market that financial traders have yet to fully price in. As veteran investor George Noble (@gnoble79) highlighted in a widely discussed X post on April 21, 2026: “Paper oil settled at $90 on Friday. Physical oil traded at $144 two weeks ago… One of them is WRONG.” Noble argues the physical market is correctly pricing in the realities of disrupted supply through the Strait of Hormuz, while paper markets are betting on a quick peace deal. He warns: “When paper catches up to physical (and 45 years of experience tells me it always does) the repricing will be VIOLENT.”
The referenced X post (full thread available in link below) breaks down the crisis: Dated Brent — the key physical benchmark for North Sea crude with confirmed loading dates — reached $144.42 on April 7, the highest since S&P Global Platts began publishing the assessment in 1987. This dwarfs 2008 peaks and reflects buyers paying “an exceptional premium for secure, refinery-usable barrels available now,” per Morgan Stanley analysts. Meanwhile, 230 loaded tankers remain trapped in the Persian Gulf, Hormuz traffic has plummeted over 90%, and workarounds for other goods (like container rerouting) simply don’t exist for crude oil volumes of 15-20 million barrels per day.
Understanding Paper vs. Physical: Why the Gap Matters
“Paper oil” refers to futures contracts on exchanges like ICE (Brent) and NYMEX (WTI). These are financial instruments used for hedging, speculation, and price discovery — not immediate delivery. Traders buy and sell promises of future barrels, often rolling positions forward. The “physical” price, by contrast, is the cash market for actual cargoes: Dated Brent, Dubai crude, or Forties blends that refiners need now for processing.
Historically, the two track closely, with small premiums or discounts reflecting storage, transport, and timing. But since the U.S.-Israel-Iran conflict escalated in late February 2026, triggering attacks on infrastructure and a near-shutdown of the Strait of Hormuz, the gap has blown out to $30–$50 per barrel at peaks. Physical Dubai crude has traded $37–$40 above its paper equivalent; North Sea Forties hit $147; Dated Brent remains elevated even after a fragile ceasefire.
This backwardation (near-term prices far higher than distant contracts) is extreme. WTI’s curve shows December 2026 futures as much as $40 below May/June 2026 levels, signaling traders expect the crisis to resolve quickly and prices to fall back toward $70–$80 by year-end.
But physical realities — depleted pre-war inventories, maxed pipelines, and stalled tankers — tell a different tale. Up to 10 million barrels per day remain trapped, with force majeure declarations on LNG and rerouted shipping underscoring the severity.
How and When Will Paper Catch Up? The Role of Newest Futures Contracts
Convergence happens through two main channels:
Physical Market Forcing Reality: As the last pre-crisis tankers unload and new cargoes load at sky-high spot prices, refiners’ costs rise. This flows into products (gasoline, diesel) and eventually pressures futures. Analysts note the gap has persisted longer than expected due to floating storage and existing inventories, but those buffers are finite. Reuters and OilPrice.com report the physical premium surged post-conflict and remains historically wide, with bids overwhelming offers in the North Sea.
Futures Rollovers and Expirations: Newest contracts (now shifting to June/July 2026 and beyond) must reflect tightening supply if disruptions persist. The current extreme backwardation assumes a swift reopening of Hormuz. But with the recent ceasefire under strain — expiring imminently amid ongoing tensions, Iranian warnings, and minimal traffic recovery — front-month contracts face upward pressure on rollover. JPMorgan has already revised forecasts: $120–$130/bbl near-term if issues drag into mid-May, with risks to $150+. Goldman Sachs and others see $20–$50 snap-ups possible.
EIA data shows Q1 2026 Brent futures averaged sharp gains amid shut-ins in Iraq, Saudi Arabia, and the UAE, but paper has lagged physical stress. If peace talks collapse or Hormuz stays restricted (Iran demanding tolls, U.S. blockade elements persisting), the curve will steepen further, or front months will spike to erase the discount.
Timing? Optimists hoped for an April resolution; realists point to months for full recovery even if the strait reopens. Physical tightness is already hitting Asia (the marginal buyer), with Dubai-linked crudes at premiums that futures can no longer ignore. History shows paper eventually aligns — often violently, via short squeezes or forced covering.
Implications: A Violent Repricing Ahead
Energy stocks remain the “most asymmetric trade,” as Noble notes. Higher physical prices mean sustained refinery margins, upstream windfalls, and broader inflation pass-throughs. U.S. gasoline is already up over $1/gallon in places. A catch-up could propel Brent well above $120–$140, reshaping 2026 forecasts that once eyed $60 averages.
The market isn’t broken — it’s bifurcated. Paper prices peace; physical prices war. When they reconcile, expect fireworks.
Appendix: Links and Sources
- George Noble X Thread: https://x.com/gnoble79/status/2046603397533511746 (April 21, 2026)
- OilPrice.com: “Paper Oil Blinks While Physical Supply Tightens” (April 14, 2026): https://oilprice.com/Energy/Crude-Oil/Paper-Oil-Blinks-While-Physical-Supply-Tightens.html
- Reuters: Physical vs. futures divergence reports (March–April 2026)
- CNBC/EIA: Backwardation and Q1 price analysis: https://www.eia.gov/todayinenergy/detail.php?id=67424
- JPMorgan Oil Price Outlook and revisions (2026)
- Additional context from Al Jazeera, MarketWatch, and CME Group on futures curve: https://www.cmegroup.com/insights/economic-research/2026/implications-of-wti-oil-futures-in-backwardation-amid-the-supply-crunch.html
Data as of April 22, 2026. Markets move fast — always verify the latest prices with primary sources like Platts or exchange quotes. Stay tuned to Energy News Beat for ongoing coverage of this critical market divergence. The physical barrel doesn’t lie — and the paper market is about to find out.
The post When the Paper Price of Oil Catches Up with the Physical Price of Delivered Oil, It Will Be a Violent Swing UP appeared first on Energy News Beat.